2024 Popular Annual Financial Report
For the fiscal year ended December 31, 2024.
To review the City of Nixa Annual Comprehensive Financial Report for the fiscal year ended December 31, 2024, click below.
Letter from Mayor Giddens
I am pleased to present to you the City of Nixa’s Popular Annual Financial Report (PAFR). This document provides a clear and concise overview of our city’s financial position, ensuring transparency and accountability in how we manage your tax dollars. This document is a supplement to the city’s Annual Comprehensive Financial Report (ACFR) which we also produce annually and make available for public review on our website.
The ACFR comprehensively details our revenues, expenditures, assets, and liabilities for the past fiscal year. It reflects our commitment to responsible fiscal management and highlights our efforts to maintain a balanced budget while investing in the services and infrastructure that enhance the quality of life in Nixa; however, we know that many citizens without a background in finance and accounting may not be able to easily interpret the data presented in the ACFR. Therefore, while this document serves as an introductory primer, we recommend that citizens seeking to understand all city finances on a deeper level consider reviewing our comprehensive reports as well.
Key highlights from this year’s report include:
- An outline of the city’s primary sources of revenue, including taxes, grants, and fees.
- A breakdown of expenditures across various departments such as public safety, public works, parks and recreation, and administrative services.
- An analysis of the city’s debt obligations and long-term financial planning initiatives.
I believe it is very important for our citizens to understand where and how city funds are being utilized. The financial health of our city is a shared responsibility, and your engagement is a large asset to our continued success. I encourage you to review the PAFR and provide us with any feedback or questions you may have.
If you need any further clarification on any aspect of the report, our Director of Finance is available to assist you. For those of you who wish to discuss specific expenditures or suggest changes, I urge you to reach out to the members of the City Council or myself directly. Your input is invaluable in guiding our financial priorities and decisions.
Together, we can ensure that Nixa remains a vibrant, financially stable community for all residents. Thank you for your attention to this important matter and for your ongoing support of our city.

City Council as of Dec. 31, 2024

Aron Peterson
District 2 | Mayor Pro Tem

Darlene Graham
District 3

Zern Vess
District 1

Shawn Lucas
District 2

Kelly Morris
District 3
Glossary of Terms
Construction in progress
Capital projects begun in one fiscal year, but not completed, and carried over into subsequent fiscal years.
Deferred inflows of resources
An acquisition of net assets by the government that is applicable to a future reporting period.
Deferred outflows of resources
A consumption of net assets by the government that is applicable to a future reporting period.
Enterprise Funds
Proprietary fund type used to report an activity for which a fee is charged to external users for goods or services.
Fee in Lieu of
A payment made from the Enterprise Funds to the General government to compensate for the franchise tax revenue lost due to the municipality’s ownership of the utility.
Franchise Tax
A fee imposed on cable and natural gas providers for use of the City’s right-of-way.
Governmental Funds
Governmental Funds are used to account for activities primarily supported by taxes, grants, and similar revenue sources.
Impact Fees
Fees imposed on property developers by municipalities for the new infrastructure which must be built to accommodate new development.
Net Position
The difference between an entity’s assets plus deferred outflows of resources and its liabilities plus deferred inflows of resources represents its net position. Net position has the following three components: net investment in capital assets; restricted net position; and unrestricted net position.
Non-Operating Revenues and Expenses
Revenues and expenses not qualifying as operating items (e.g. taxes, grants that are not equivalent to contracts for services, and most interest revenue and expense).
Operating Revenues and Expenses
Cost of goods sold and services provided to customers and the revenue thus generated.
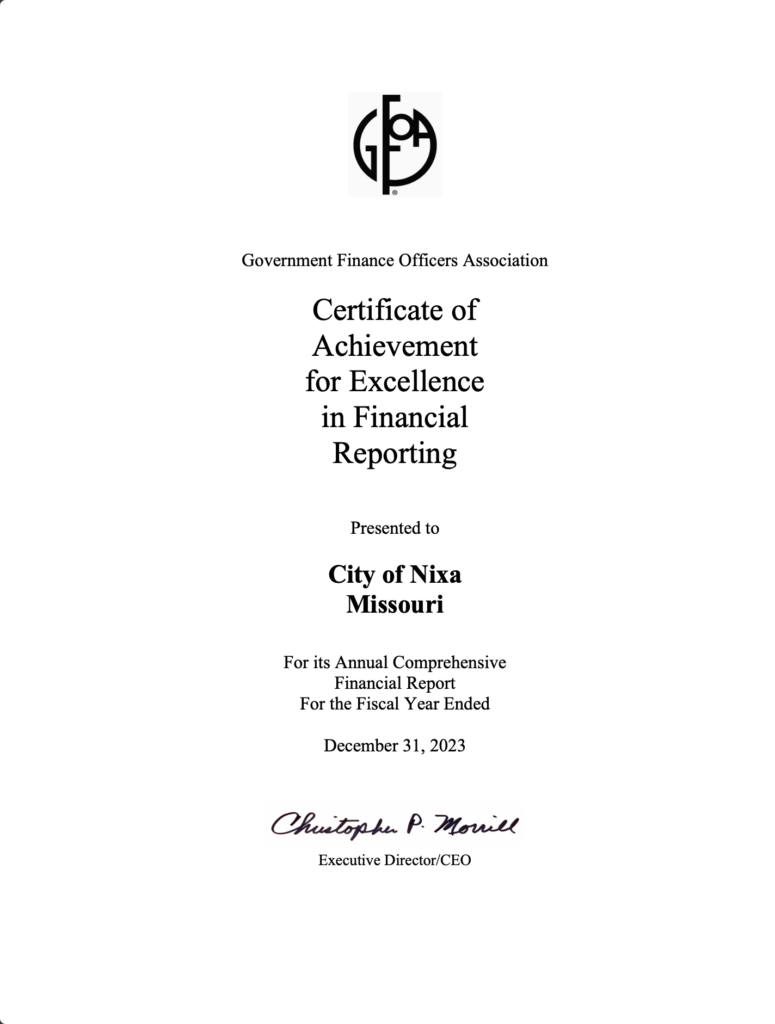
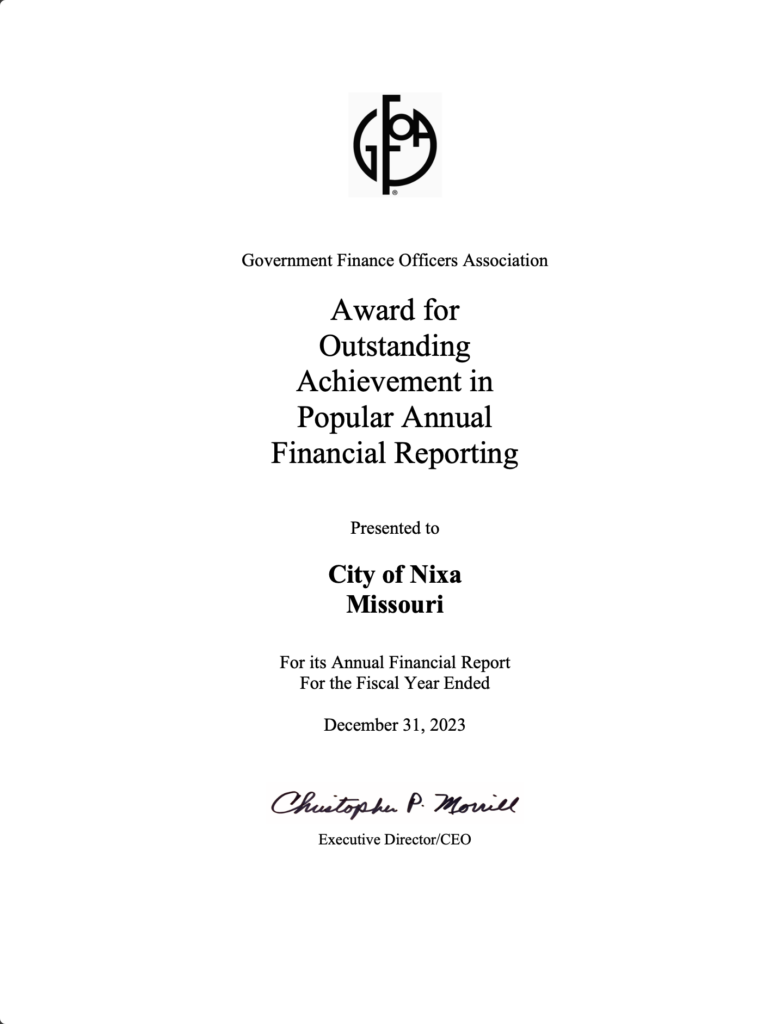
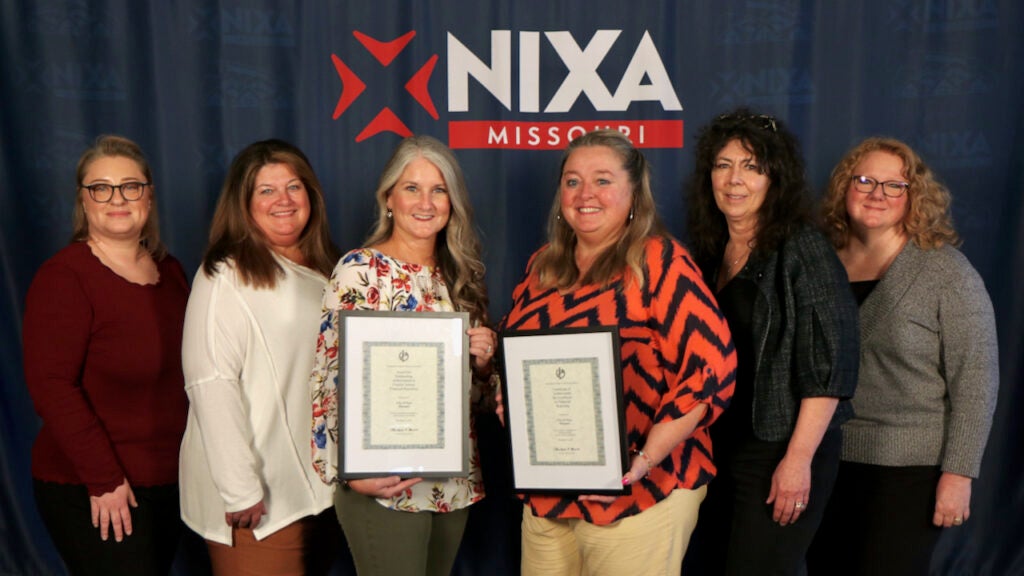
Recognitions earned for financial reporting for the fiscal year ended December 31, 2023:

How many square miles inside Nixa City limits?
8.57 square miles

What is Nixa’s current population?
The U.S. Census Bureau estimates that Nixa’s population in 2024 was 26,352.
What is Nixa’s median household income?
$80,491
What is Nixa’s median age?
35.8
What is Nixa’s unemployment rate?
3.1%
How many full-time employees work for the City of Nixa?
173
How many students were enrolled in Nixa Public Schools in Fall of 2024?
6,792
Which are the Top 10 employers in Nixa?
How much has Nixa’s population grown over the last 10 years?
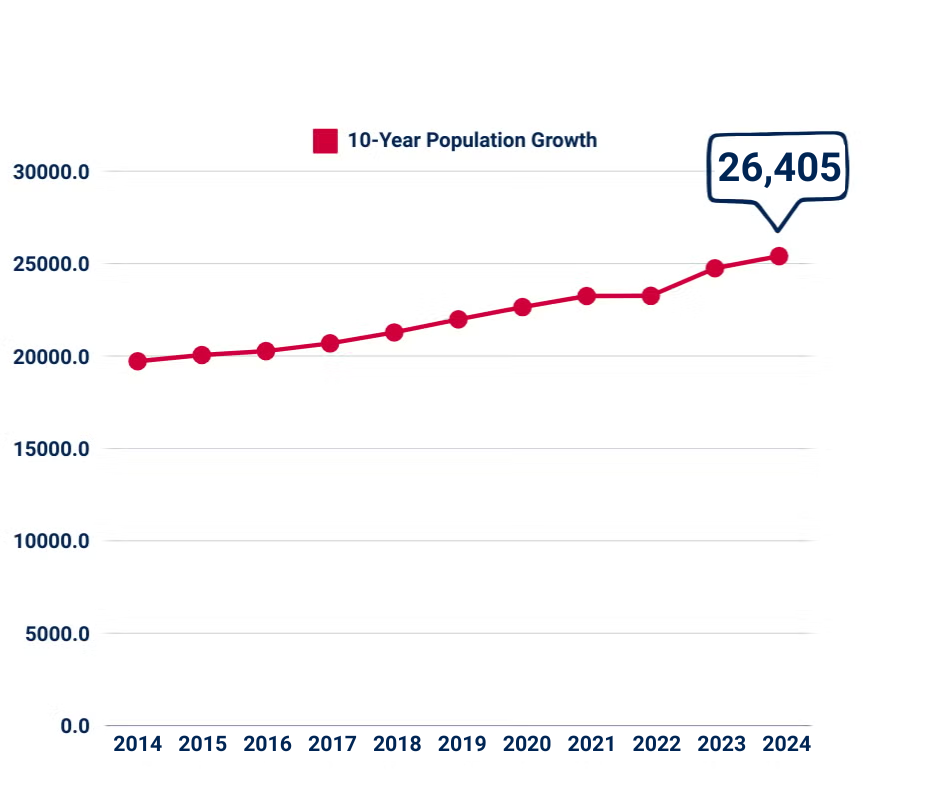
How much new commercial construction in Nixa over the last 10 years?
10-Year New Commercial Construction Permits Issued & Estimated Construction Costs
| Year | Permits Issued | Estimated Cost of Construction |
|---|---|---|
| 2024 | 15 | $97,702,998 |
| 2023 | 2 | $1,900,000 |
| 2022 | 7 | $19,300,000 |
| 2021 | 4 | $1,190,000 |
| 2020 | 14 | $16,881,000 |
| 2019 | 10 | $16,035,000 |
| 2018 | 18 | $7,185,201 |
| 2017 | 6 | $465,000 |
| 2016 | 8 | $47,148,000 |
| 2015 | 5 | $4,892,000 |
| 2014 | 17 | $12,113,000 |
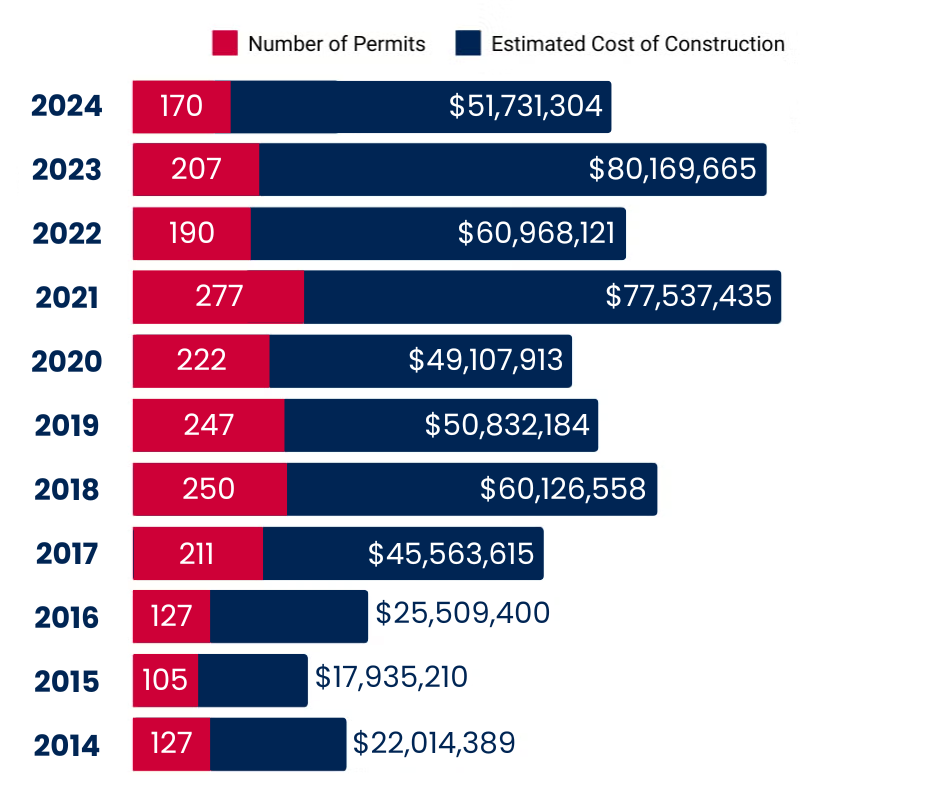
How much new residential construction in Nixa over the last 10 years?
10-Year New Residential Construction Permits Issued & Estimated Construction Costs
Council District Map:
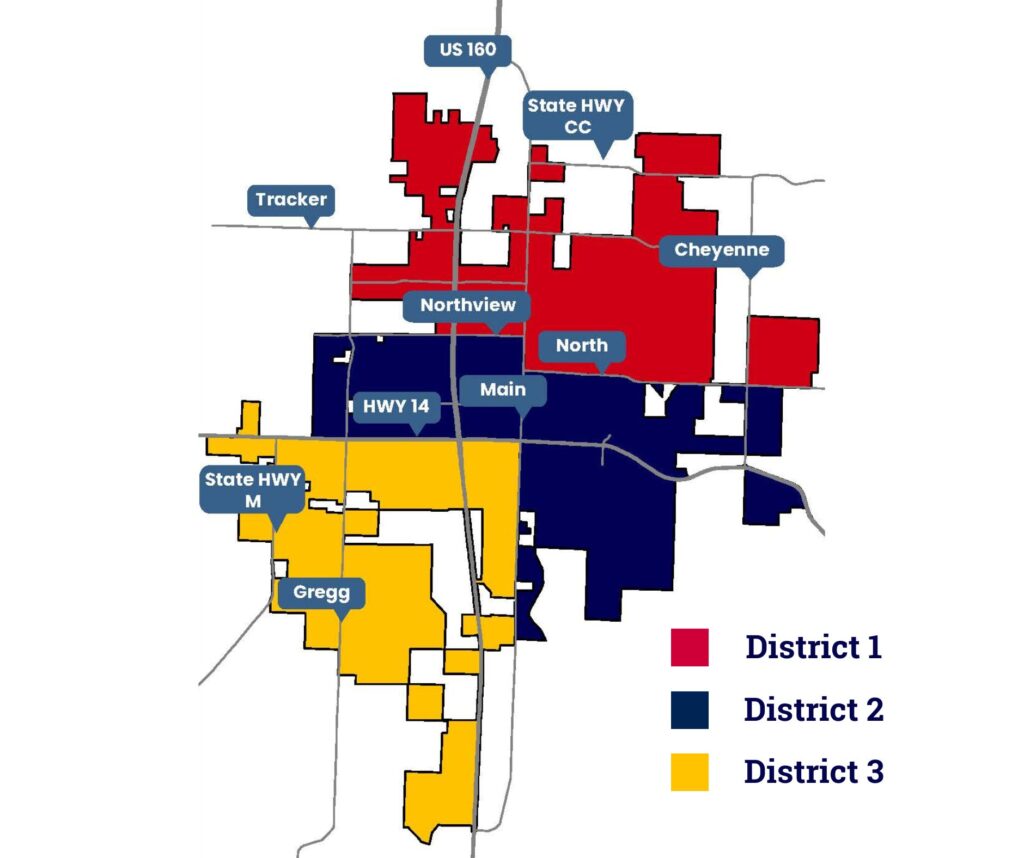
The City of Nixa is divided into 3 council districts. Each district elects two council members to represent them. All districts vote for the Mayoral seat.
District 1 is described as being north of Northview and North Streets.
District 3 is described as being west of S. Main Street and south of Rt. 14 (Mt. Vernon St.).
District 2 encompasses areas west of 160 bordered on the north by Northview and on the south by Rt. 14, and east of S. Main St. bordered on the north by North St.
Development Activity in 2023
In 2023, single family residential development occurred in the following areas: Cheyenne Valley, Irish Hills, Forest Heights, Walnut Creek Manor, Meadowbrook, Kelby Creek, and The Estates of Enniskerry at Wicklow. Development activities included subdivision infrastructure development and/or home construction within the subdivision.
Total 2023 single-family home construction permits issued: 207
Total 2023 multi-family construction permits issued: 11 permits for a total of 393 new dwelling units (apartments & single-family).
How much money does the city have?
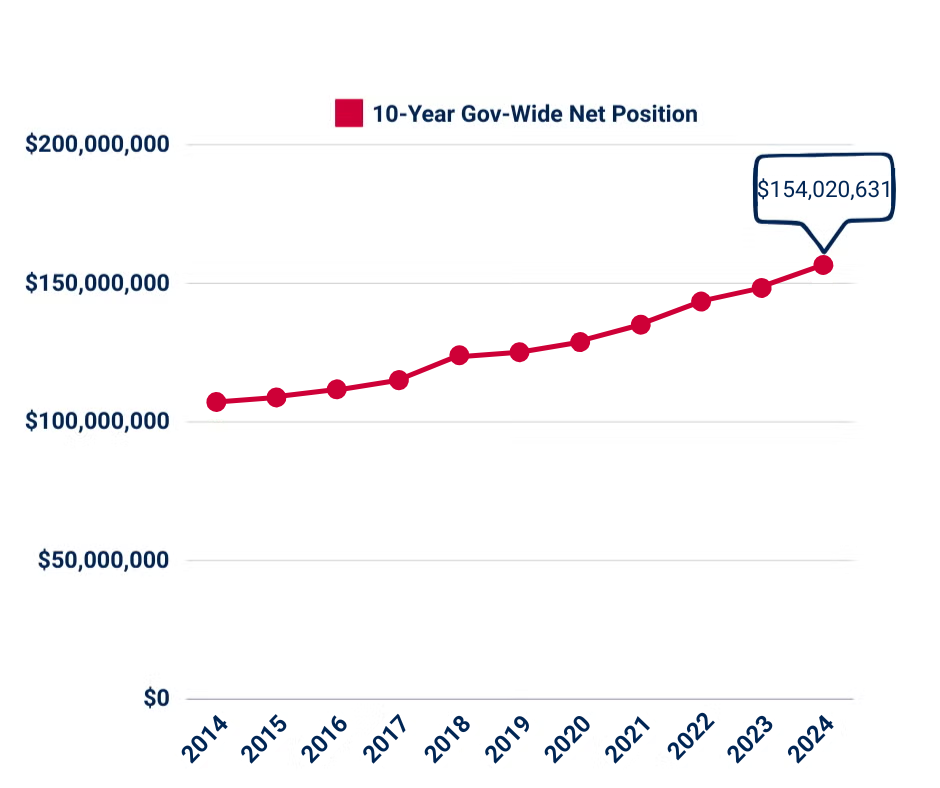
Net Position
Net position is a good indicator of the general financial health of the City. Net position is the difference between the City’s assets and deferred outflows of resources, and liabilities and deferred inflows of resources. Over time, increases or decreases in net position may serve as a useful indicator of whether the financial position of the City of Nixa is improving or deteriorating. The City’s net position is the sum of the net position of our Governmental Funds plus the net position of the Enterprise Funds.
What’s the difference between Governmental Funds and Enterprise Funds?
Governmental funds get most of their revenue from taxes. Enterprise funds (business-type activities) get their revenue from charges for services. The City of Nixa has three enterprise funds to account for our utility services. Nixa Utilities is a not-for-profit enterprise owned and operated by the city. Service charges for our electric, water and wastewater utilities must cover personnel, operations, debt service, and capital expenses for these departments. The city does not use tax revenue to operate, maintain, or improve our utility systems, rather, our customers cover those costs by paying their utility bills. You can see the differences in revenues and expenses for each of these fund types in the tabs above for Governmental Funds and Enterprise Funds.
5 Classifications of Governmental Fund Balances:
Within Governmental Funds, every dollar is labeled as one of the following five classifications:
Non-Spendable:
This classification includes amounts which cannot be spent either because they are not in spendable form or because they are legally or contractually required to be maintained intact.
Restricted:
This classification includes amounts which can be spent only for specific purposes because of the City Charter, City Code, state, or federal laws or externally imposed conditions by grantors or creditors.
Committed:
This classification includes amounts which can be used only for specific purposes determined by a formal action by the City Council. Such formal action may be in the form of an ordinance and may only be modified or rescinded by a subsequent formal action.
Assigned:
This classification includes amounts which are intended by the City to be used for a specific purpose but are neither restricted nor committed. Assignments may be made only by the governmental body or official.
Unassigned:
This classification represents the residual positive balance within the General Fund, which has not been restricted, committed, or assigned. In funds other than the General Fund, unassigned fund balances are limited to negative residual balances.
Governmental Fund Balances
Total Governmental Fund Balances = $15,769,453 (General Fund + Street Fund)
As of Dec. 31, 2024
| General Fund | Street Fund | ||
|---|---|---|---|
| Nonspendable: | $37,035 | Nonspendable: | $11,140 |
| Restricted: | $2,223 | Restricted: | $3,354,783 |
| Committed: | $0 | Committed: | $0 |
| Unassigned: | $12,364,272 | Unassigned: | $0 |
| General Fund: | $12,403,530 | Total Street Fund: | $3,365,923 |
Where Does the Money Come From?
Total Revenues:
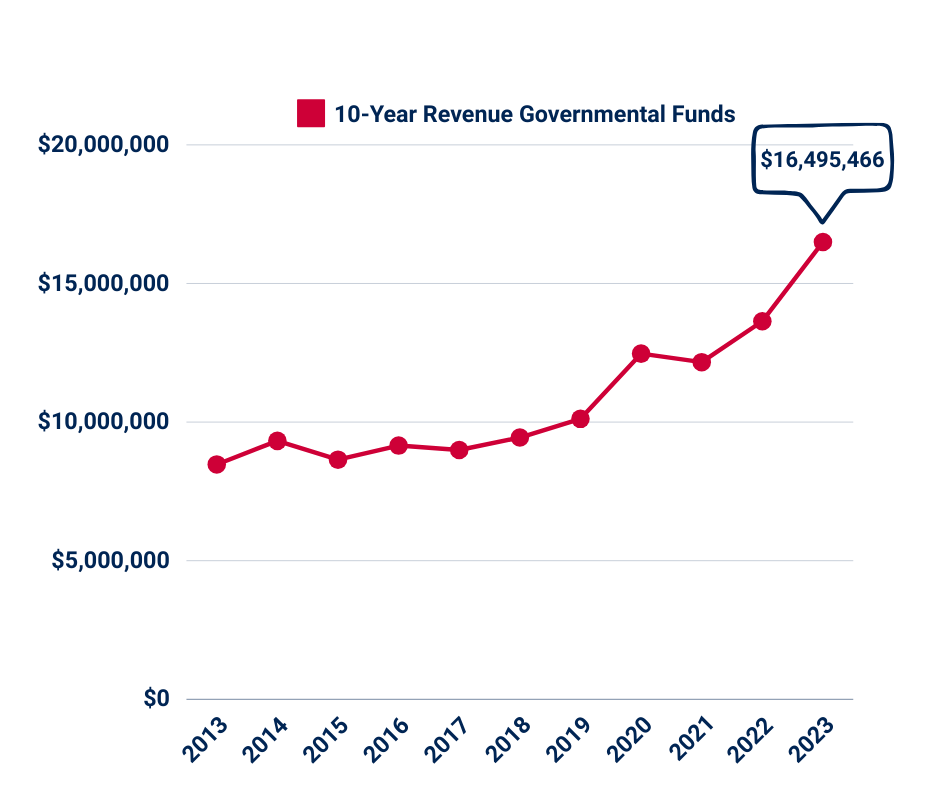
Understanding Governmental Funds Revenue Sources:
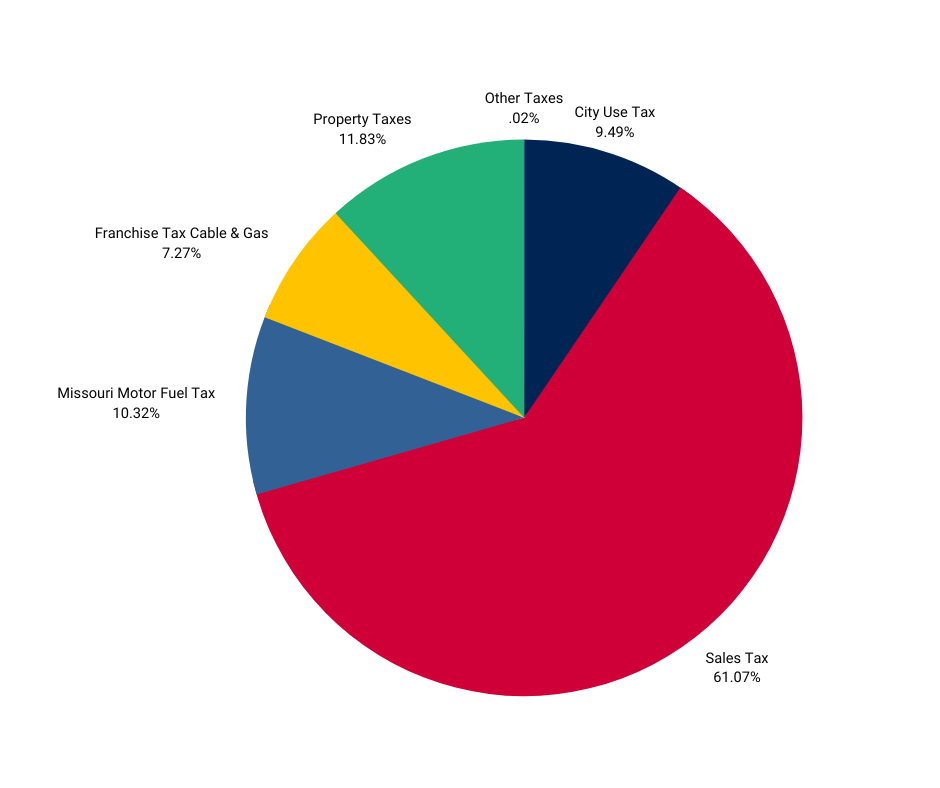
Governmental funds revenue comes mostly from taxes. The sales tax rate for the City of Nixa is 2.25%. Of this, 1.75% is a general sales tax, (1.0% for general purposes and 0.75% for public safety) and 0.5% is a transportation sales tax which is dedicated only for street department use. This 2.25% sales tax is what anyone pays when making certain purchases at businesses inside city limits or when they purchase something online to be delivered to a Nixa address.
All revenue from Nixa’s half-cent transportation sales tax and all of Nixa’s portion of Missouri motor fuel taxes may only be spent within the Street fund. Nixa voters approved a 3/4 -cent additional general sales tax in April of 2023 dedicated to public safety. This revenue will only be used to help fund the Police Department.
Nixa collects a real property tax based on the assessed value of real estate property, but Nixa does not collect any personal property tax.
The “franchise tax” is 5% of gross sales of cable TV and natural gas services, because those service providers use the city’s right-of-way to deliver those services.
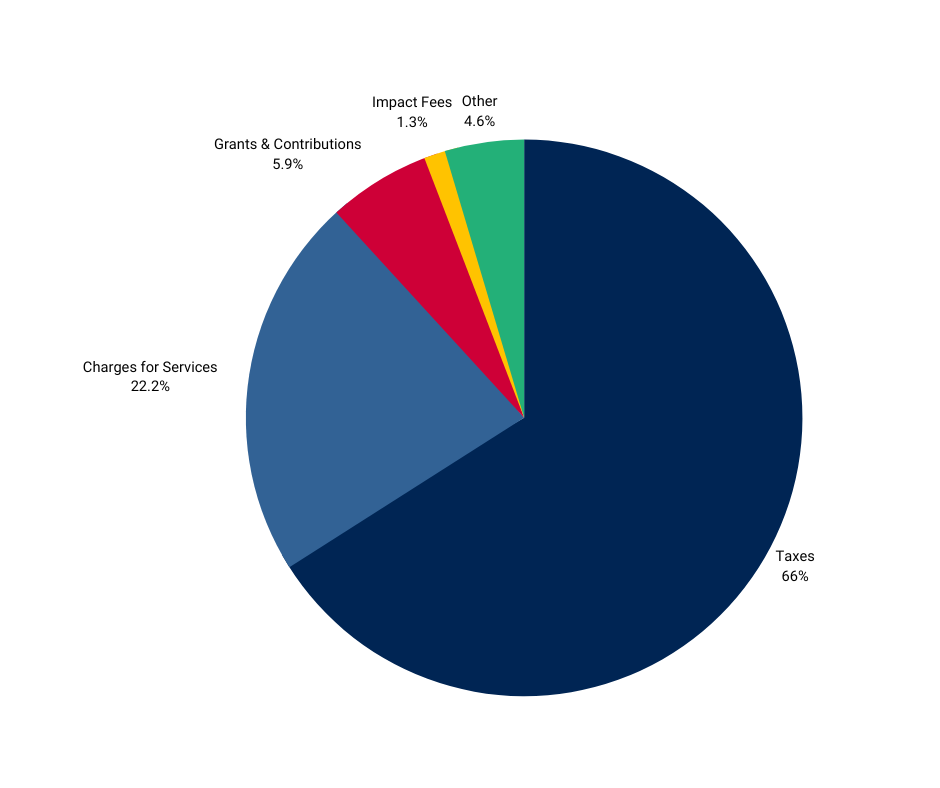
*Other revenue sources includes the following categories:
- Investment Earnings: $729,044
- Miscellaneous: $36,576
- Licenses & Permits: $68,358
- Fines & Forfeitures: $101,873
- Rents: $1,100
Tax Revenues:
2023 Tax Revenues by Source:
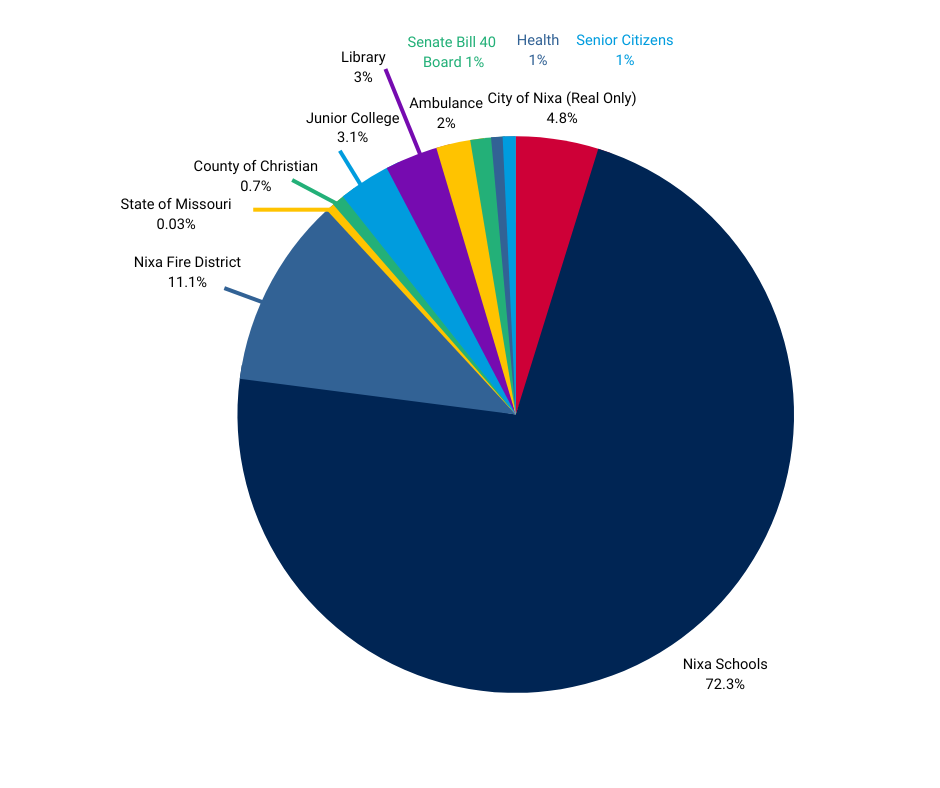
How much of your property tax is for municipal government?
How much of the sales tax is for municipal government?
2023 Direct & Overlapping Sales Tax Rates
Where Does the Money Go?
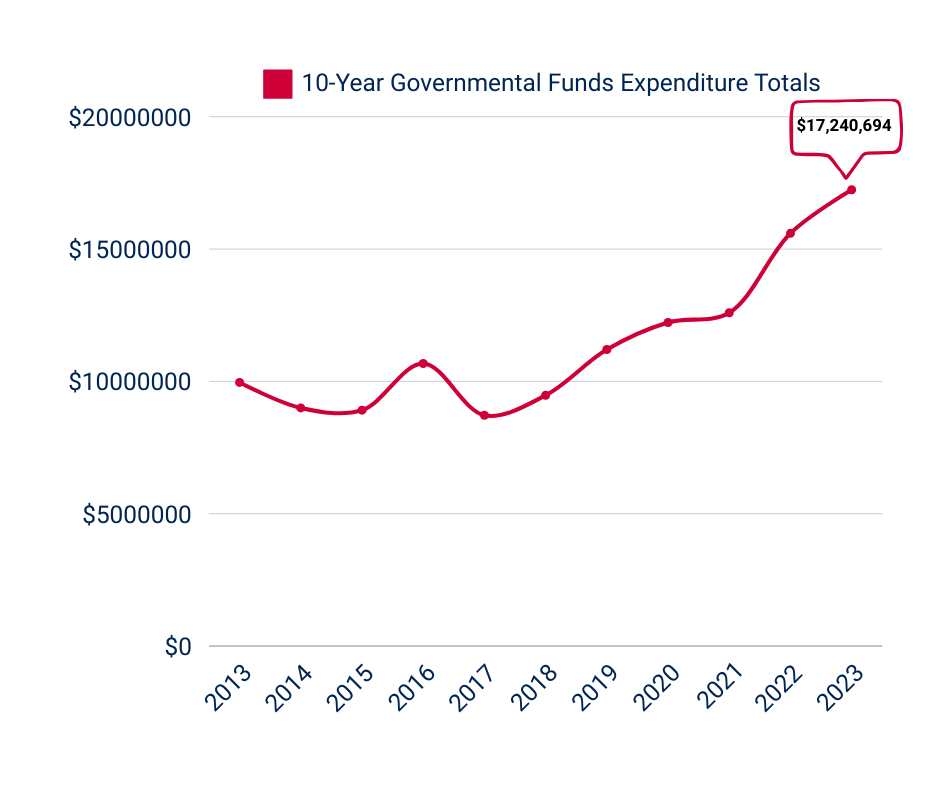
Expenditures:
Understanding Governmental Funds Expenditures by Function:
The City spends governmental funds on different functions divided by department.
Expenditures within each department function include:
- Personnel
- Operations
- Maintenance
Paying our debts and capital expenditures are separate functions.

Debt Service:
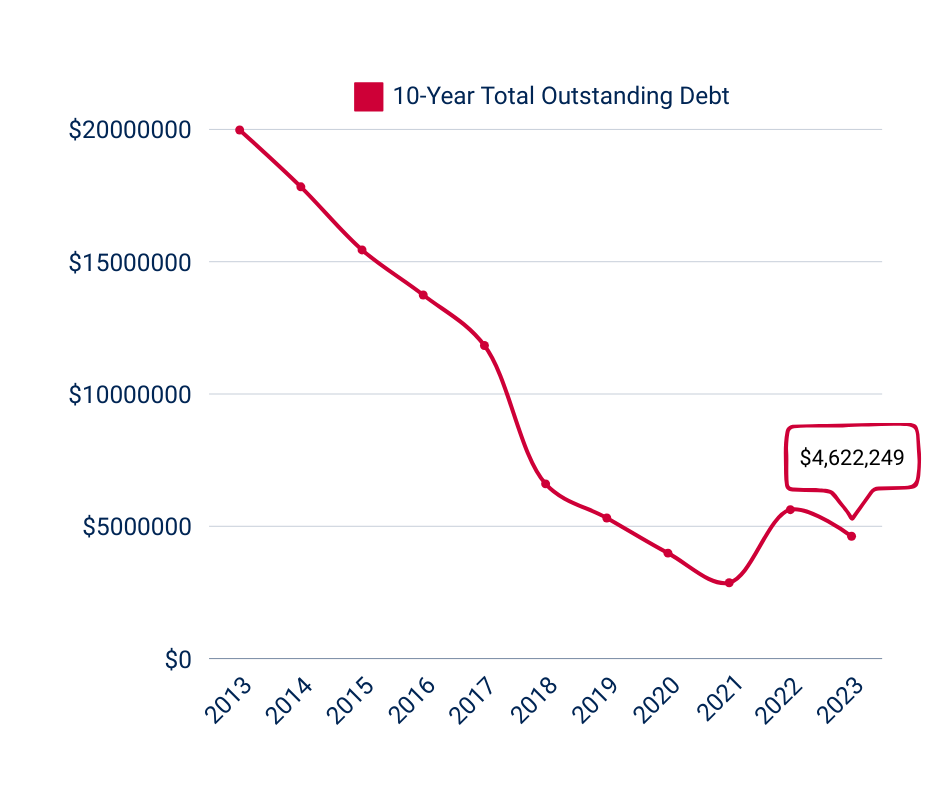
Understanding the City’s current debt:
In 2023, the City of Nixa paid off two debt issues, leaving three outstanding issues as of 12-31-2023.
Of the three remaining issues, two will be paid off in 2024 with the remaining issue set to mature in 2031. The debt per capita at the end of 2023 is $182 which is down from $849 in 2014. Our total outstanding debt at the end of 2023 was $4,622,249.
Capital Improvement Projects (CIPs):
Capital expenditures are big projects paid for in cash. We try to plan for these 5 years in advance, and budget accordingly so we can afford these large projects using cash rather than taking out additional debt.
Top 5 Governmental Fund CIPs in 2023:
| Truman Blvd. Road Improvements | $1,861,520 | |
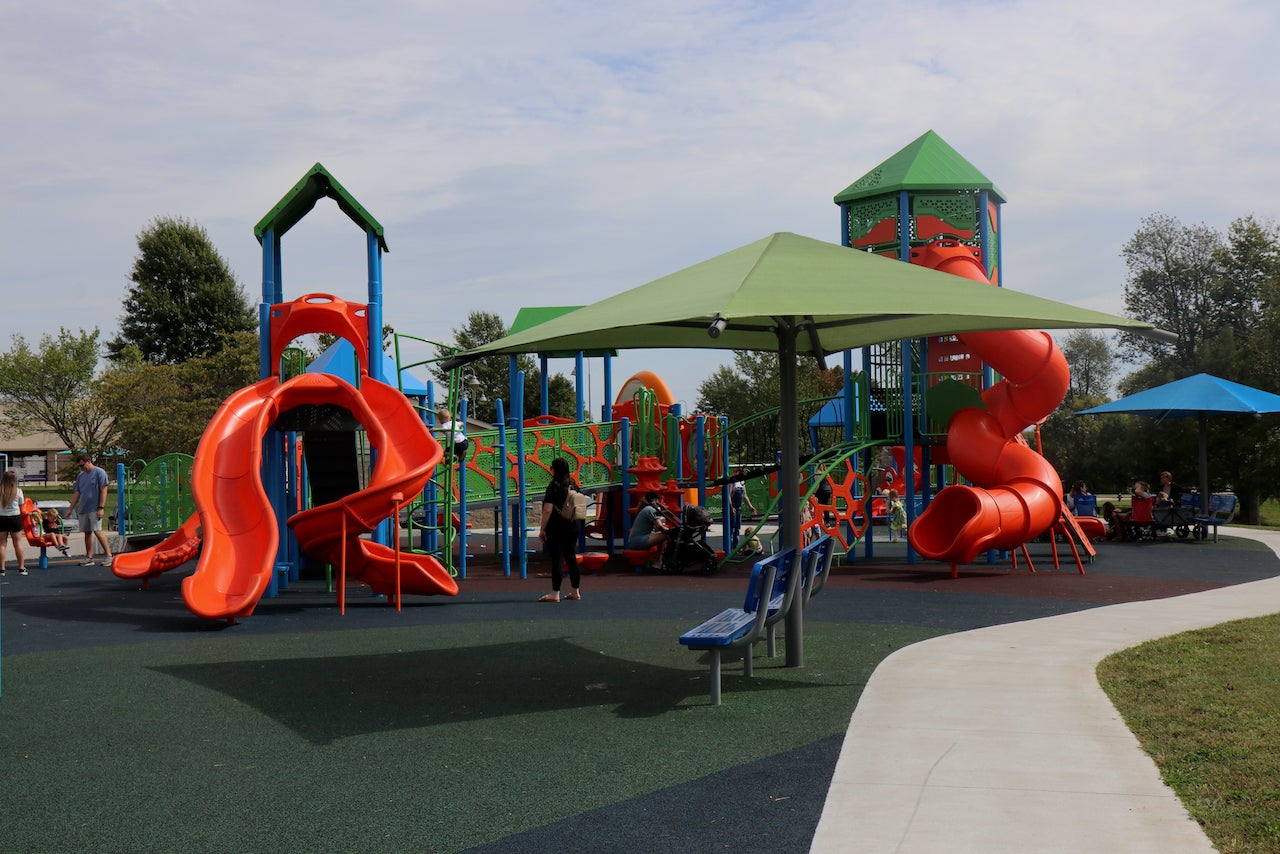
| McCauley Park Inclusive Playground | $1,093,027 | |
| Police Shooting Range | $888,919 | |
| ERP | $475,840 | |
| Stormwater Improvements | $436,725 |
Enterprise Fund Net Position
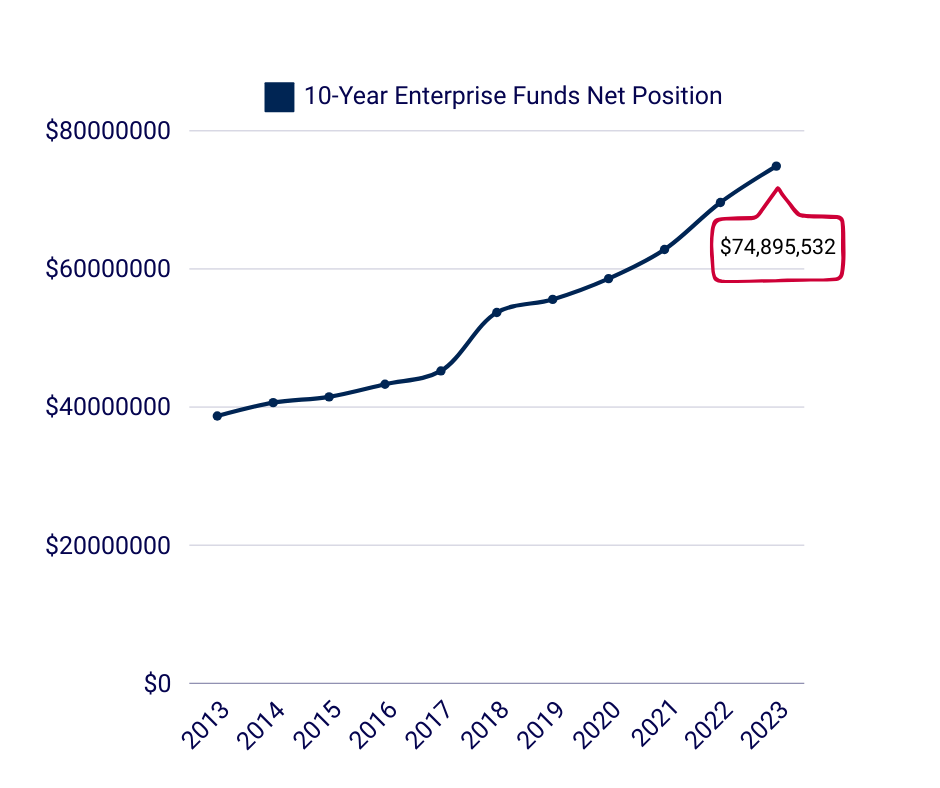
Where Does the Money Come From?
Revenues by Fund
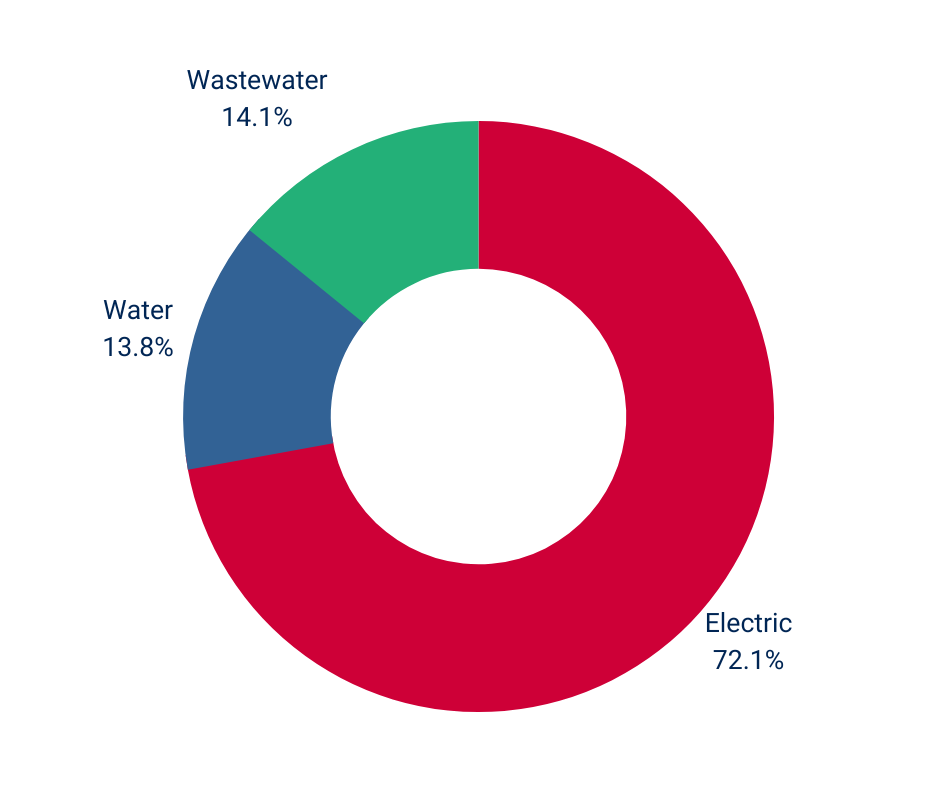
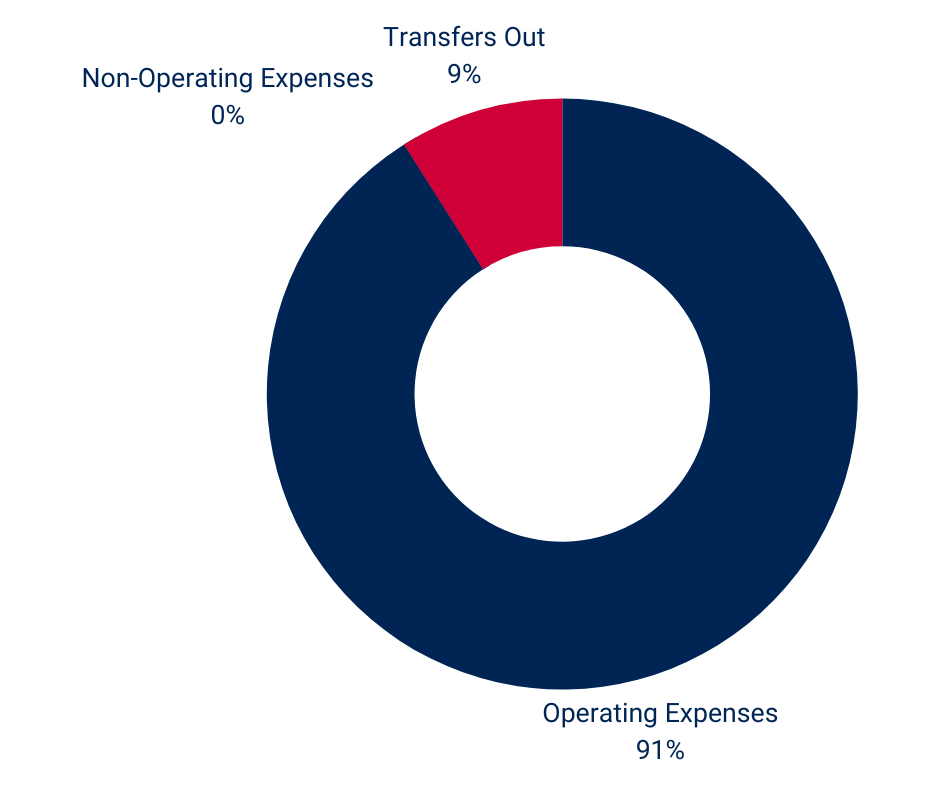
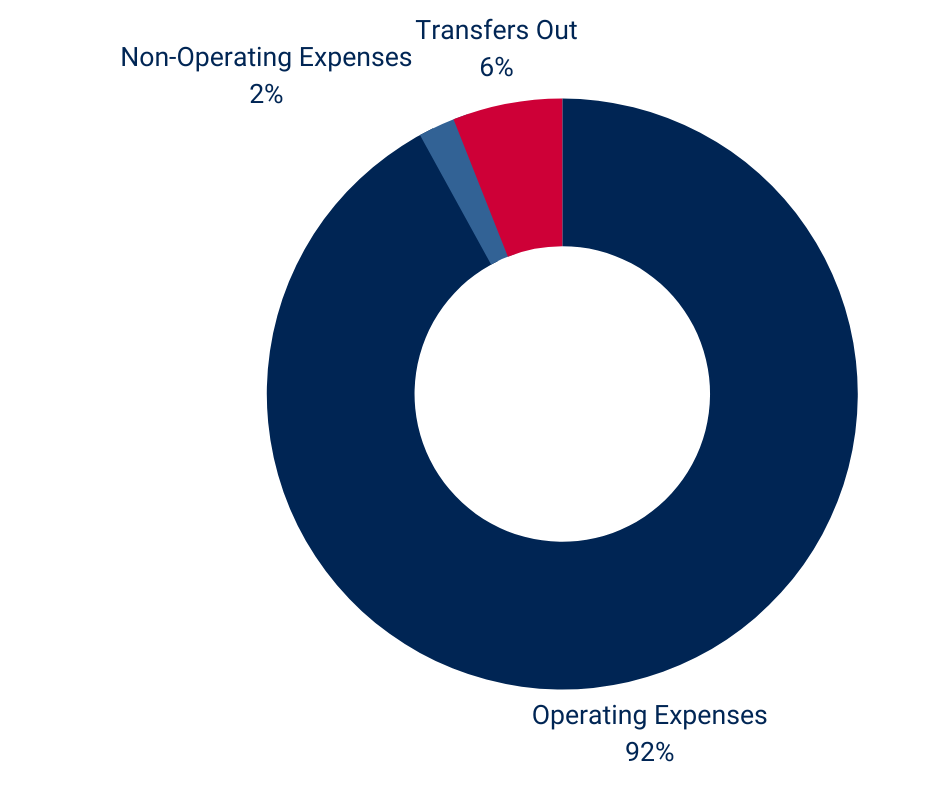
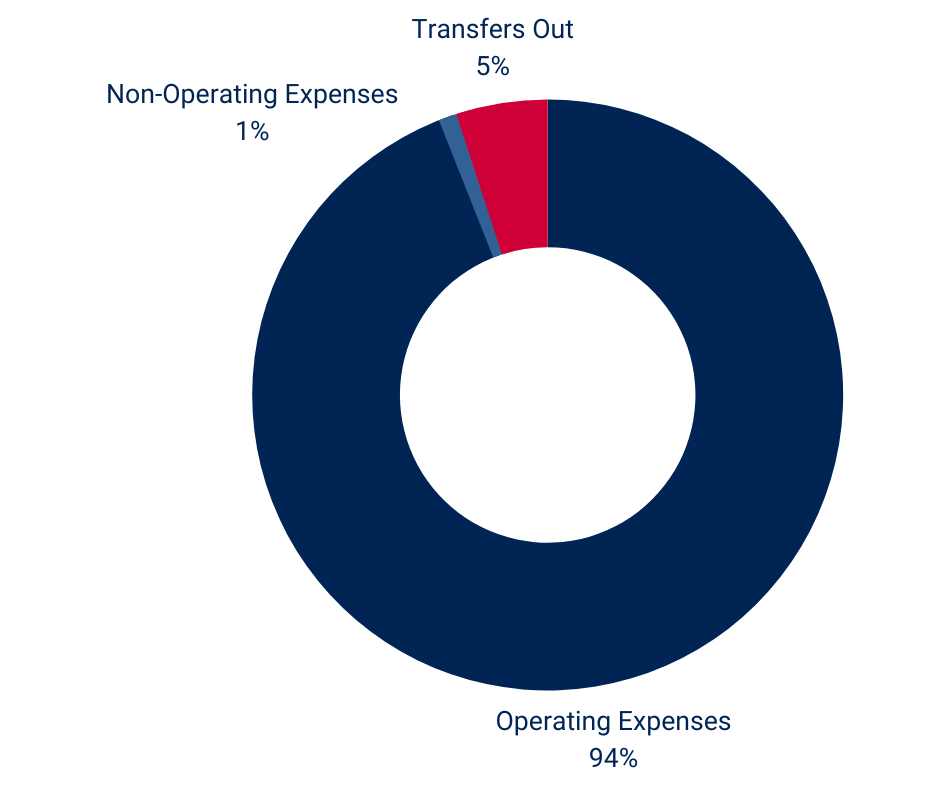
Where Does the Money Go?
Expenses by Fund
