2022 Popular Annual Financial Report
For the fiscal year ended December 31, 2022.
Letter from Mayor Steele
The City of Nixa prides itself on fiscal responsibility and transparency with our citizens. It is in this spirit we have produced this document. During the development of the city’s strategic plan for 2021-2025, our citizens said they want us to provide more easily digestible information about the city’s money. We hope this document will be a useful tool for our community to understand the basics of our city finances.
This document provides a clear and concise overview of the city’s financial position so our citizens can more easily understand how the city manages its money.
To understand the city finances, other contextual information about our community and the operations of our municipal government is also necessary. Therefore, you will find other relevant statistics and data throughout this document in addition to financial information.
This document is a supplement to the city’s Annual Comprehensive Financial Report (ACFR) which we also produce annually and make available for public review on our website.
The ACFR provides much in-depth information regarding the city’s financial position, but we know that many citizens without a background in finance and accounting may hot be able to easily interpret the data presented in the ACFR. While this document serves as an introductory primer, we recommend that citizens seeking to understand all city finances on a deeper level consider reviewing our comprehensive reports as well.
If, upon review of these documents, you continue to have questions or concerns about city finances, I encourage you to reach out to our Director of Finance directly for clarifications. If you wish for the city to consider making any changes to revenues, expenditures, or any financial practices, I encourage you to contact your council members and myself so we may take your ideas and concerns into consideration as we plan the city’s next budget.
Thank you for taking time to review this document and for educating yourself on Nixa’s financial position and city operations. I strongly believe that informed and engaged citizens are vital to our community and the continual improvement of our local government.

City Council as of Dec. 31, 2022

Jarad Giddens
District 1

Aron Peterson
District 2

Darlene Graham
District 3

Matt Ogden
District 1

Shawn Lucas
District 2

Seth Balogh
District 3
Glossary of Terms
Construction in progress
Capital projects begun in one fiscal year, but not completed, and carried over into subsequent fiscal years.
Deferred inflows of resources
An acquisition of net assets by the government that is applicable to a future reporting period.
Deferred outflows of resources
A consumption of net assets by the government that is applicable to a future reporting period.
Enterprise Funds
Proprietary fund type used to report an activity for which a fee is charged to external users for goods or services.
Fee in Lieu of
A payment made from the Enterprise Funds to the General government to compensate for the franchise tax revenue lost due to the municipality’s ownership of the utility.
Franchise Tax
A fee imposed on cable and natural gas providers for use of the City’s right-of-way.
Governmental Funds
Governmental Funds are used to account for activities primarily supported by taxes, grants, and similar revenue sources.
Impact Fees
Fees imposed on property developers by municipalities for the new infrastructure which must be built to accommodate new development.
Net Position
The difference between an entity’s assets plus deferred outflows of resources and its liabilities plus deferred inflows of resources represents its net position. Net position has the following three components: net investment in capital assets; restricted net position; and unrestricted net position.
Non-Operating Revenues and Expenses
Revenues and expenses not qualifying as operating items (e.g. taxes, grants that are not equivalent to contracts for services, and most interest revenue and expense).
Operating Revenues and Expenses
Cost of goods sold and services provided to customers and the revenue thus generated.
Recognitions earned for financial reporting in the 2021 budget year:

How many square miles inside Nixa City limits?
8.57 square miles
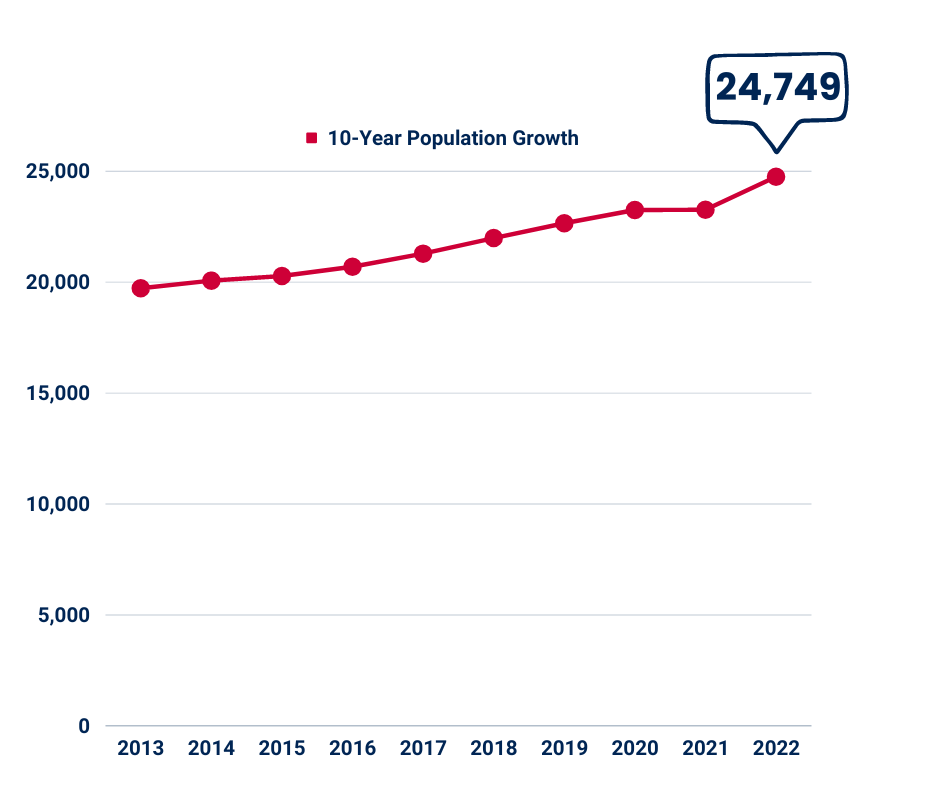
What is Nixa’s current population?
The U.S. Census Bureau estimates that Nixa’s population on July 1, 2022 was 24,749.
What is Nixa’s median household income?
$66,264
What is Nixa’s median age?
34.8
What is Nixa’s unemployment rate?
2.0%
How many full-time employees work for the City of Nixa?
152
How many students were enrolled in Nixa Public Schools in Fall of 2022?
6,718
Which are the Top 10 employers in Nixa?
| Rank | Employer Name | Number of Full-Time Employees | Percentage of Total City Employment |
|---|---|---|---|
| 1. | Nixa Public Schools | 824 | 13.73% |
| 2. | Walmart | 439 | 7.32% |
| 3. | City of Nixa | 152 | 2.53% |
| 4. | Diversified Plastic | 150 | 2.50% |
| 5. (tied) | Total Highspeed | 80 | 1.33% |
| 5. (tied) | Alps Pharmacy | 80 | 1.33% |
| 6. | Nixa Hardware | 78 | 1.30% |
| 7. | The Castlewoods Senior Living | 73 | 1.22% |
| 8. (tied) | Alliance Bus Company | 70 | 1.17% |
| 8. (tied) | Nixa Nursing & Rehab | 70 | 1.17% |
| 9. | Springfield Marine | 68 | 1.13% |
| 10. | Cush Corporation | 66 | 1.10% |
How much has Nixa’s population grown over the last 10 years?
How much new commercial construction in Nixa over the last 10 years?
10-Year New Commercial Construction Permits Issued & Estimated Construction Costs
| Year | Permits Issued | Estimated Cost of Construction |
|---|---|---|
| 2022 | 7 | $19,300,000 |
| 2021 | 4 | $1,190,000 |
| 2020 | 14 | $16,881,000 |
| 2019 | 10 | $16,035,000 |
| 2018 | 18 | $7,185,201 |
| 2017 | 6 | $465,000 |
| 2016 | 8 | $47,148,000 |
| 2015 | 5 | $4,892,000 |
| 2014 | 17 | $12,113,000 |
| 2013 | 5 | $4,024,000 |
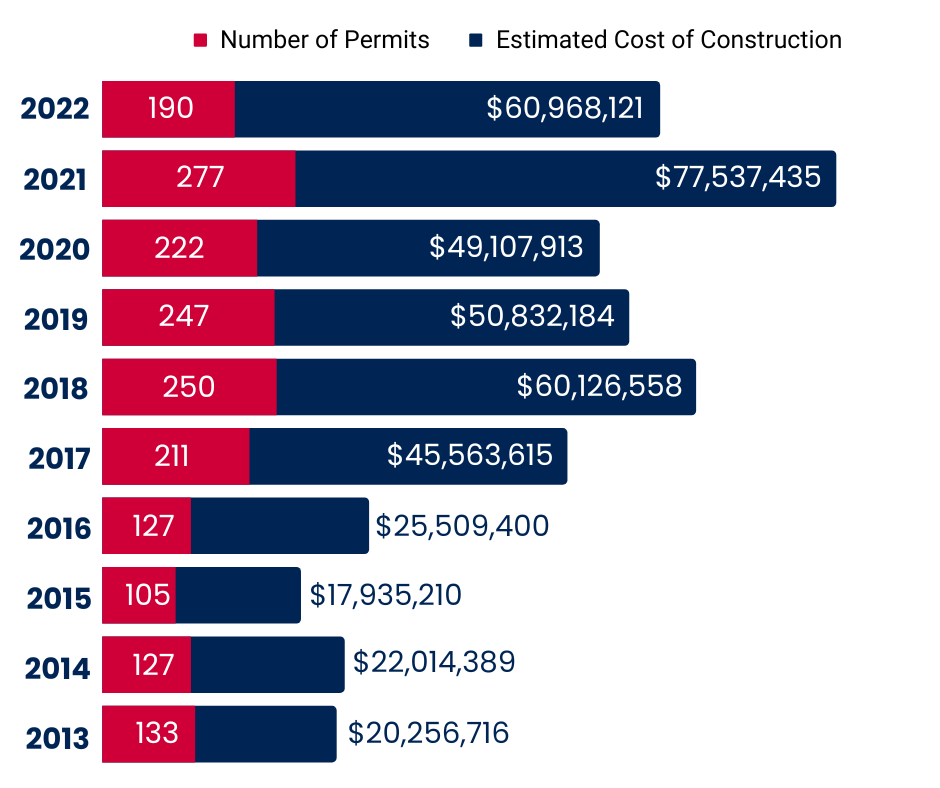
How much new residential construction in Nixa over the last 10 years?
10-Year New Residential Construction Permits Issued & Estimated Construction Costs
Council District Map:
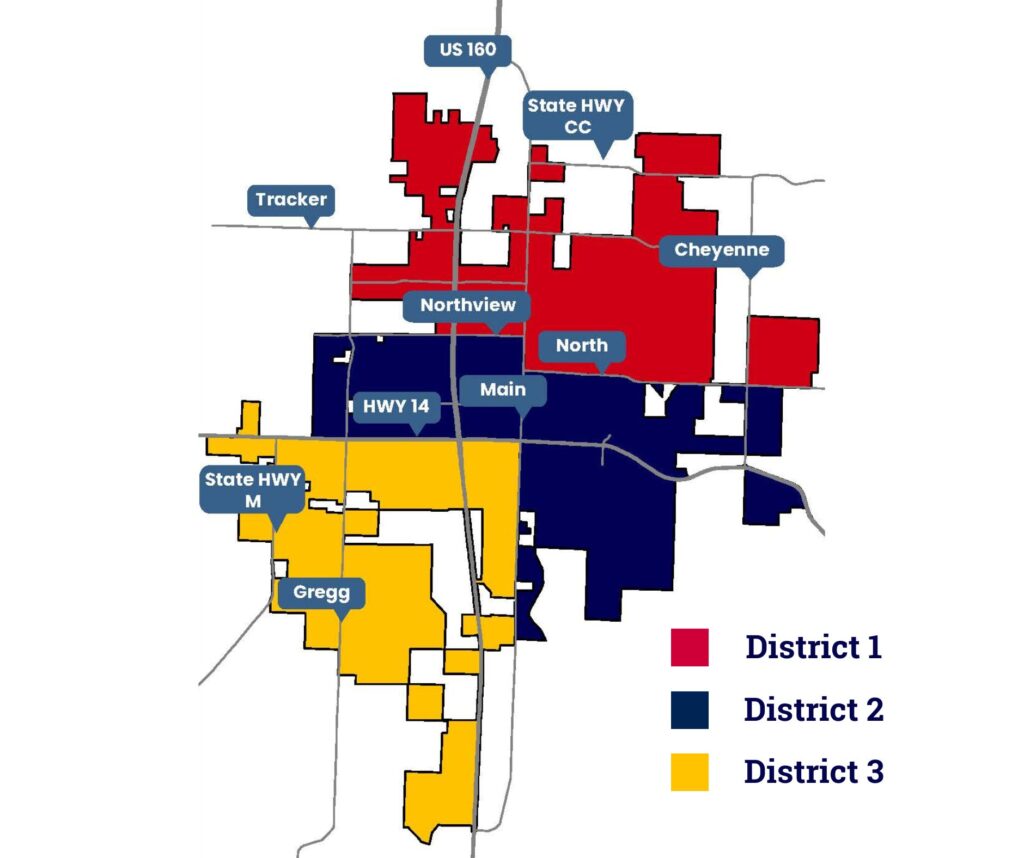
The City of Nixa is divided into 3 council districts. Each district elects two council members to represent them. All districts vote for the Mayoral seat.
District 1 is described as being north of Northview and North Streets.
District 3 is described as being west of S. Main Street and south of Rt. 14 (Mt. Vernon St.).
District 2 encompasses areas west of 160 bordered on the north by Northview and on the south by Rt. 14, and east of S. Main St. bordered on the north by North St.
Development Activity in 2022
In 2022, single family residential development occurred in the following areas: Cheyenne Valley, Irish Hills, Forest Heights, Walnut Creek Manor, Meadowbrook, Kelby Creek, and The Estates of Enniskerry at Wicklow. Development activities included subdivision infrastructure development and/or home construction within the subdivision.
Total 2022 single-family home construction permits issued: 199
Total 2022 multi-family construction permits issued: 4 permits for a total of 98 new dwelling units.
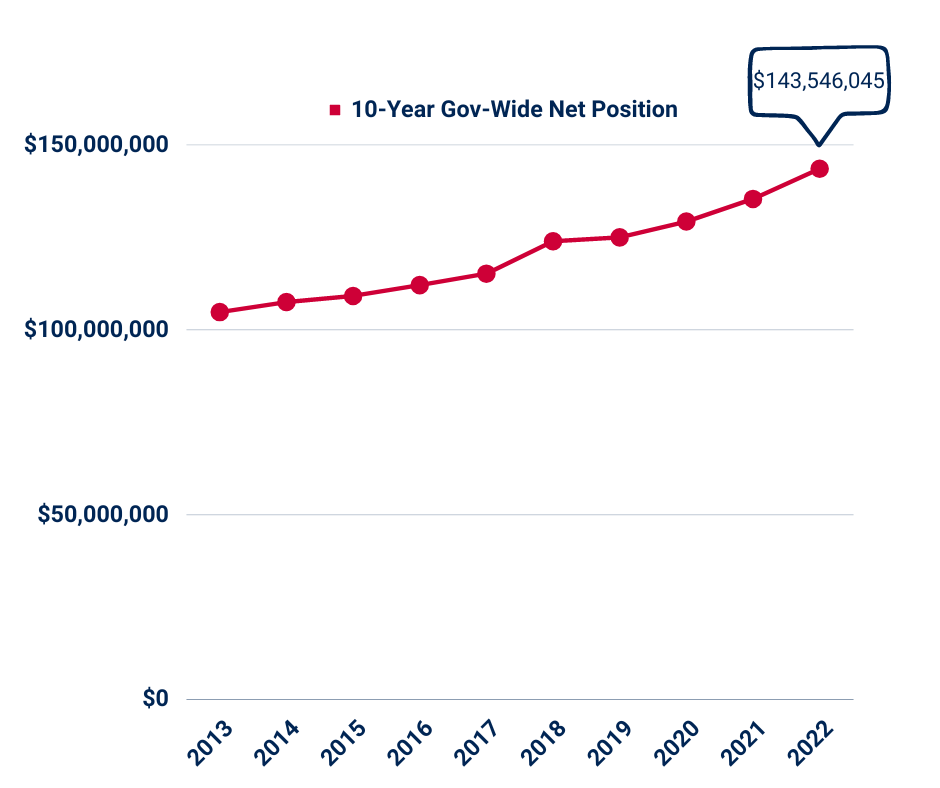
How much money does the city have?
Net Position
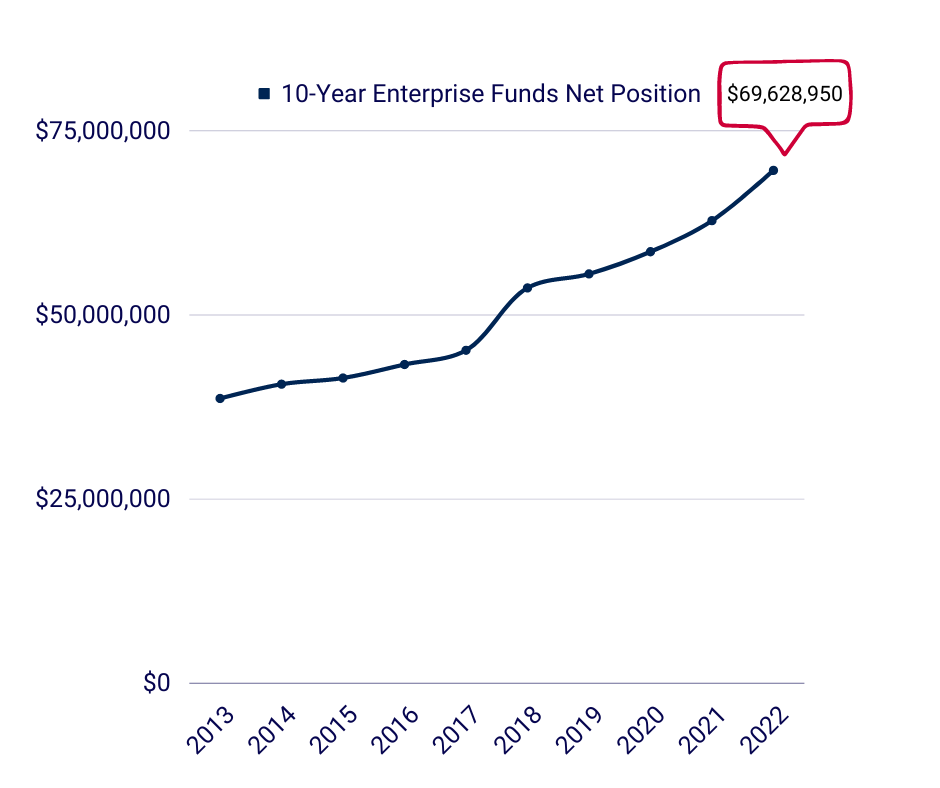
Net position is a good indicator of the general financial health of the City. Net position is the difference between the City’s assets and deferred outflows of resources, and liabilities and deferred inflows of resources. Over time, increases or decreases in net position may serve as a useful indicator of whether the financial position of the City of Nixa is improving or deteriorating. The City’s net position is the sum of the net position of our Governmental Funds plus the net position of the Enterprise Funds.
What’s the difference between Governmental Funds and Enterprise Funds?
Governmental funds get most of their revenue from taxes. Enterprise funds (business-type activities) get their revenue from charges for services. The City of Nixa has three enterprise funds to account for our utility services. Nixa Utilities is a not-for-profit enterprise owned and operated by the city. Service charges for our electric, water and wastewater utilities must cover personnel, operations, debt service, and capital expenses for these departments. The city does not use tax revenue to operate, maintain, or improve our utility systems, rather, our customers cover those costs by paying their utility bills. You can see the differences in revenues and expenses for each of these fund types in the tabs above for Governmental Funds and Enterprise Funds.
5 Classifications of Governmental Fund Balances:
Within Governmental Funds, every dollar is labeled as one of the following five classifications:
Non-Spendable:
This classification includes amounts which cannot be spent either because they are not in spendable form or because they are legally or contractually required to be maintained intact.
Restricted:
This classification includes amounts which can be spent only for specific purposes because of the City Charter, City Code, state, or federal laws or externally imposed conditions by grantors or creditors.
Committed:
This classification includes amounts which can be used only for specific purposes determined by a formal action by the City Council. Such formal action may be in the form of an ordinance and may only be modified or rescinded by a subsequent formal action.
Assigned:
This classification includes amounts which are intended by the City to be used for a specific purpose but are neither restricted nor committed. Assignments may be made only by the governmental body or official.
Unassigned:
This classification represents the residual positive balance within the General Fund, which has not been restricted, committed, or assigned. In funds other than the General Fund, unassigned fund balances are limited to negative residual balances.
Governmental Fund Balances
Total Governmental Fund Balances = $14,247,130 (General Fund + Street Fund)
As of Dec. 31, 2022
| General Fund | |
|---|---|
| Nonspendable: | $26,292 |
| Restricted: | $117,572 |
| Committed: | $0 |
| Unassigned: | $10,432,228 |
| Total General Fund: | $10,576,092 |
| Street Fund | |
|---|---|
| Nonspendable: | $7,013 |
| Restricted: | $3,664,025 |
| Committed: | $0 |
| Unassigned: | $0 |
| Total Street Fund: | $3,671,038 |
Where Does the Money Come From?
Total Revenues:
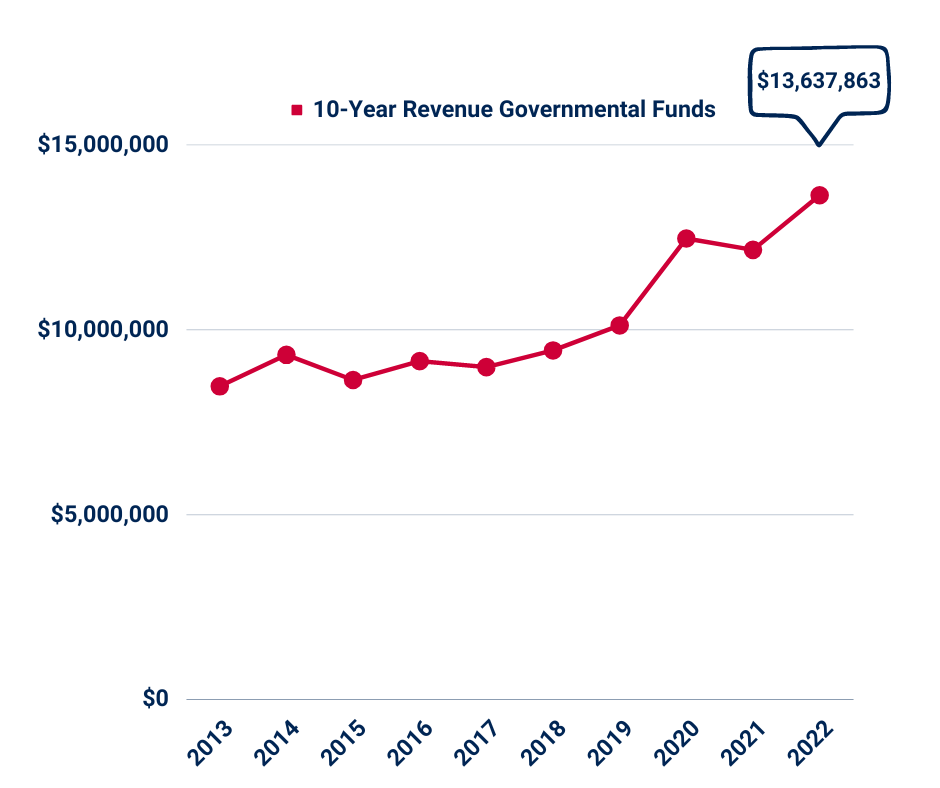
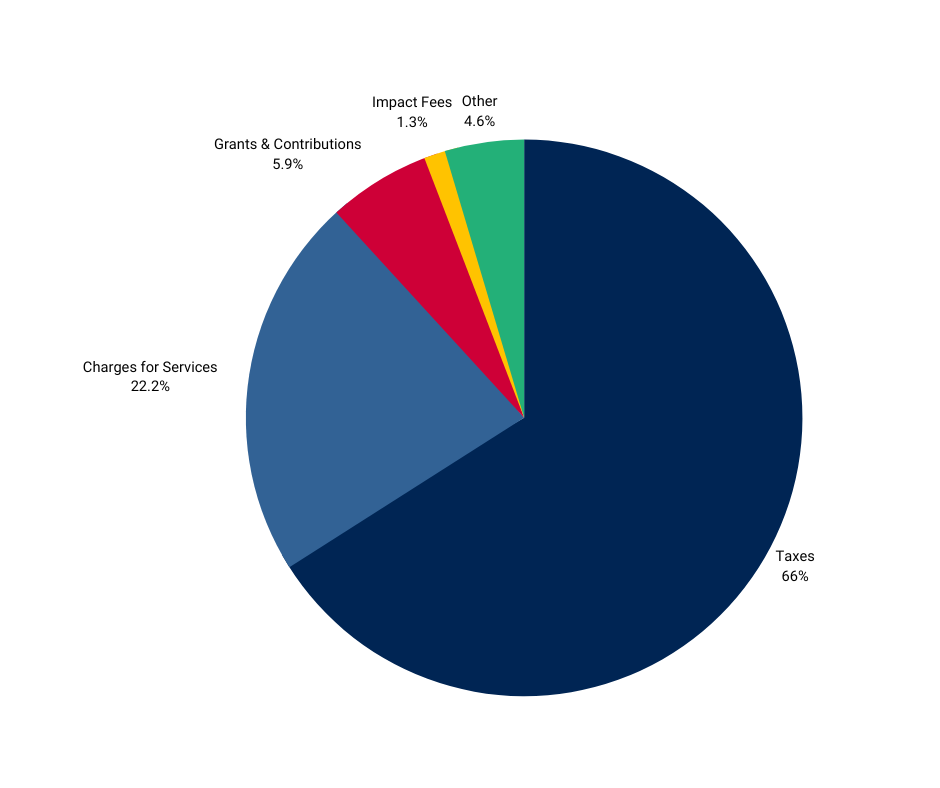
Understanding Governmental Funds Revenue Sources:
Governmental funds revenue come mostly from taxes. The largest portion of the city’s tax revenue comes from the 1.5% sales and use tax (1.0% general, plus 0.5% transportation), which is what anyone pays when they make certain purchases at businesses inside city limits or when they purchase something online to be delivered to a Nixa address.
All revenue from Nixa’s half-cent sales tax for Streets and all of Nixa’s portion of Missouri motor fuel taxes may only be spent within the street fund.
Nixa collects a real property tax based on the assessed value of real estate property, but Nixa does not collect any personal property tax.
The “franchise tax” is 5% of gross sales of cable TV and natural gas services, because those service providers use the city’s right-of-way to deliver those services.
| Revenue Source | 2022 Actual Revenue | Percentage of Revenue |
|---|---|---|
| Taxes | $8,998,066 | 66.0% |
| Charges for Services | $3,032,224 | 22.2% |
| Grants & Contributions | $811,287 | 5.9% |
| Impact Fees | $168,560 | 1.4% |
| Other* | $627,726 | 4.6% |
| Total: | $13,637,863 | 100% |
*Other revenue sources includes the following categories:
- Investment Earnings: $254,230
- State of Missouri Project Reimbursement: $214,162
- Miscellaneous: $80,412
- Licenses & Permits: $48,715
- Fines & Forfeitures: $29,007
- Rents: $1,200
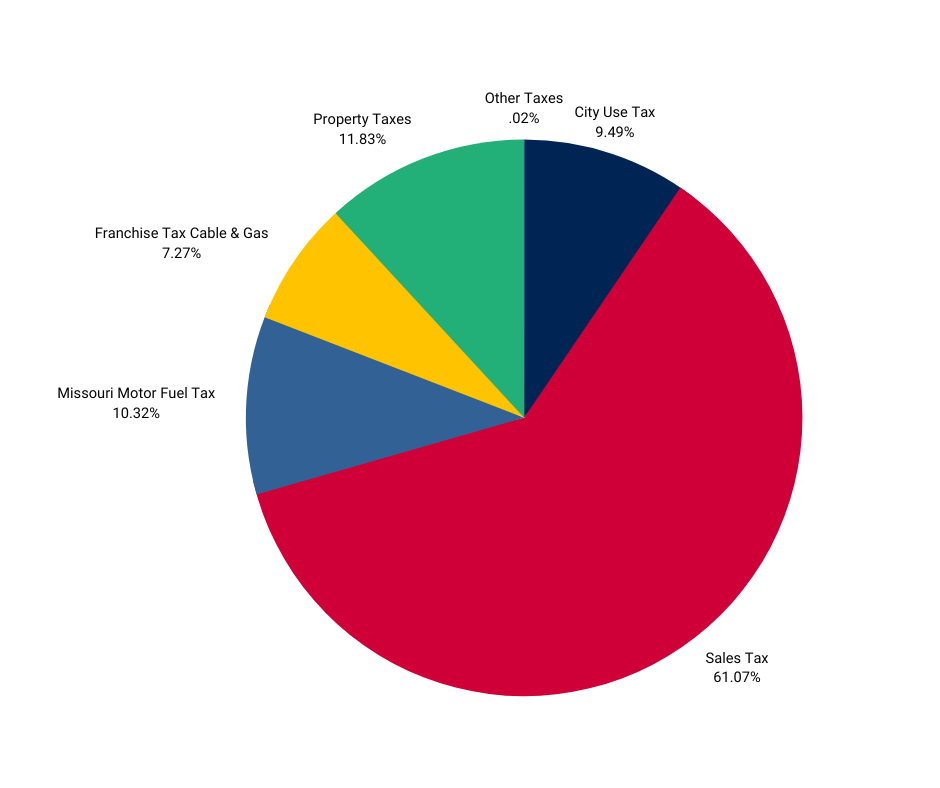
Tax Revenues:
2022 Tax Revenues by Source:
| Tax Type | Tax Revenues in 2022 | Percentage of Total Tax Revenue |
|---|---|---|
| Sales Tax | $5,495,176 | 61.07% |
| City Use Tax | $853,580 | 9.49% |
| Property Taxes | $1,064,689 | 11.83% |
| Missouri Motor Fuel Tax | $928,930 | 10.32% |
| Franchise Tax (Cable & Gas) | $654,263 | 7.27% |
| Other Taxes | $1,428 | 0.02% |
| Total Tax Revenues: | $8,998,066 | 100% |
How much of your property tax is for municipal government?
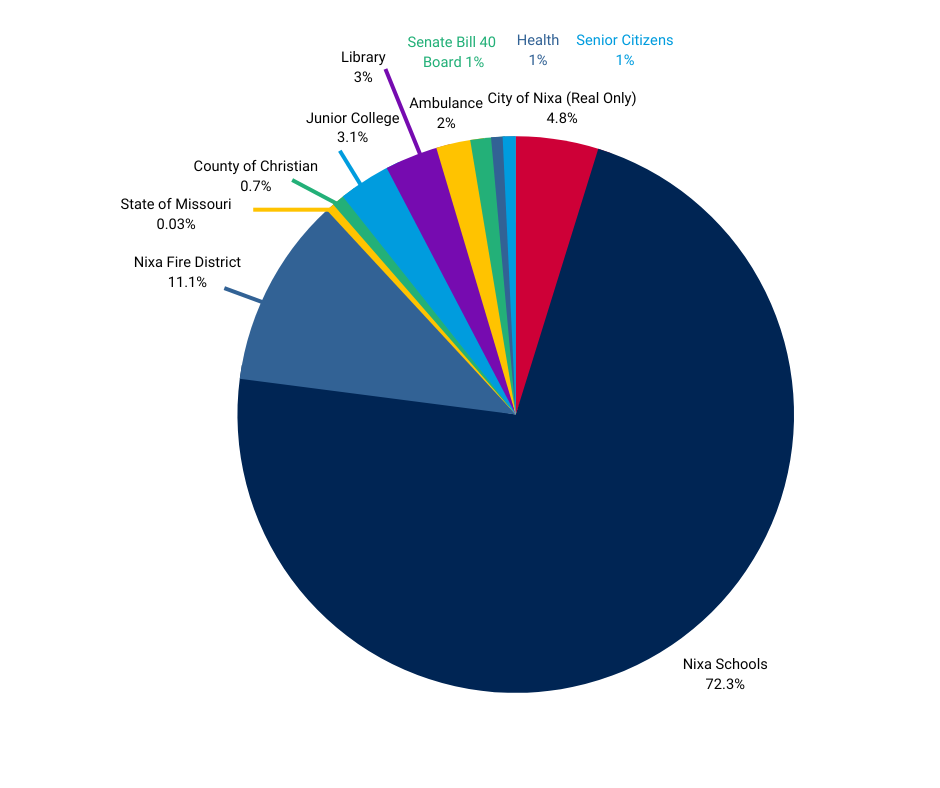
| Overlapping Districts | Total Property Tax: $6.24 (per $100 assessed value) |
|---|---|
| Nixa Public Schools | $4.51 |
| Nixa Fire Protection District | $0.69 |
| City of Nixa (real property only, no personal property) | $0.30 |
| Christian County Library | $0.19 |
| Junior College (OTC) | $0.19 |
| Christian County Ambulance District | $0.12 |
| Senate Bill 40 Board | $0.07 |
| County of Christian | $0.05 |
| Senior Citizens (Senior Center) | $0.05 |
| Christian County Health Department | $0.04 |
| State of Missouri | $0.03 |
How much of the sales tax is for municipal government?
2022 Direct & Overlapping Sales Tax Rates
| Taxing District | Sales Tax Rate as of Dec. 31, 2022 |
|---|---|
| State of Missouri | 4.225% |
| City of Nixa | 1.500% (1.0% General + 0.5% Transportation) |
| Christian County | 1.500% |
| Christian County 911 | 0.250% |
| Total Rate within Nixa city limits: | 7.475% |
Where Does the Money Go?
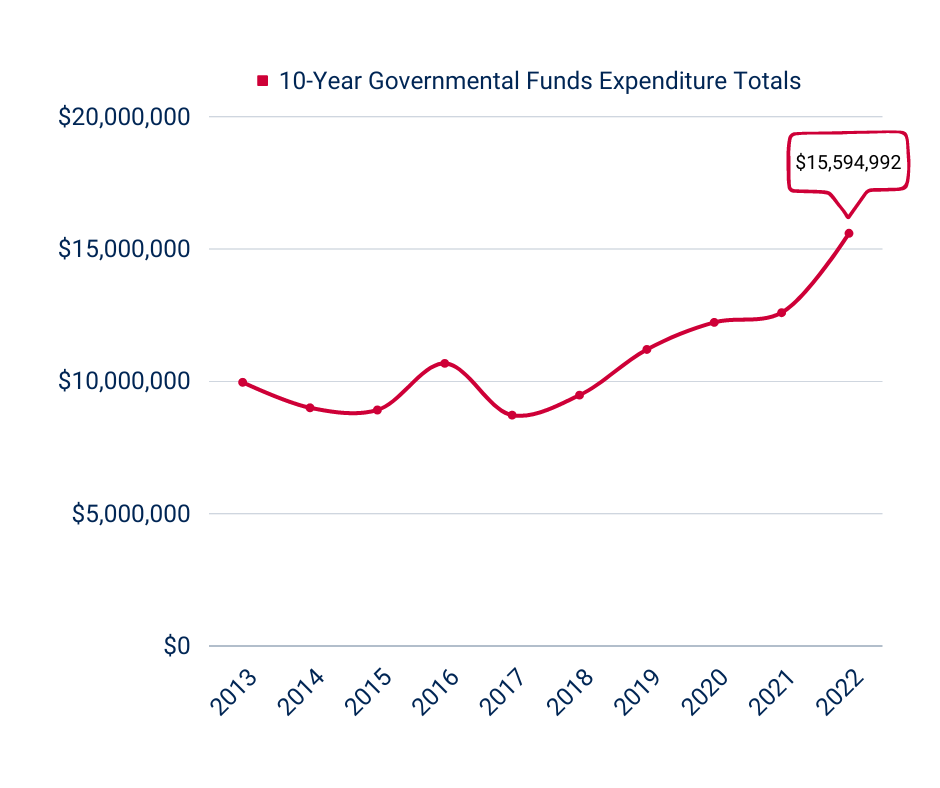
Expenditures:
Understanding Governmental Funds Expenditures by Function:
The City spends governmental funds on different functions divided by department.
Expenditures within each department function include:
- Personnel
- Operations
- Maintenance
Paying our debts and capital expenditures are separate functions.
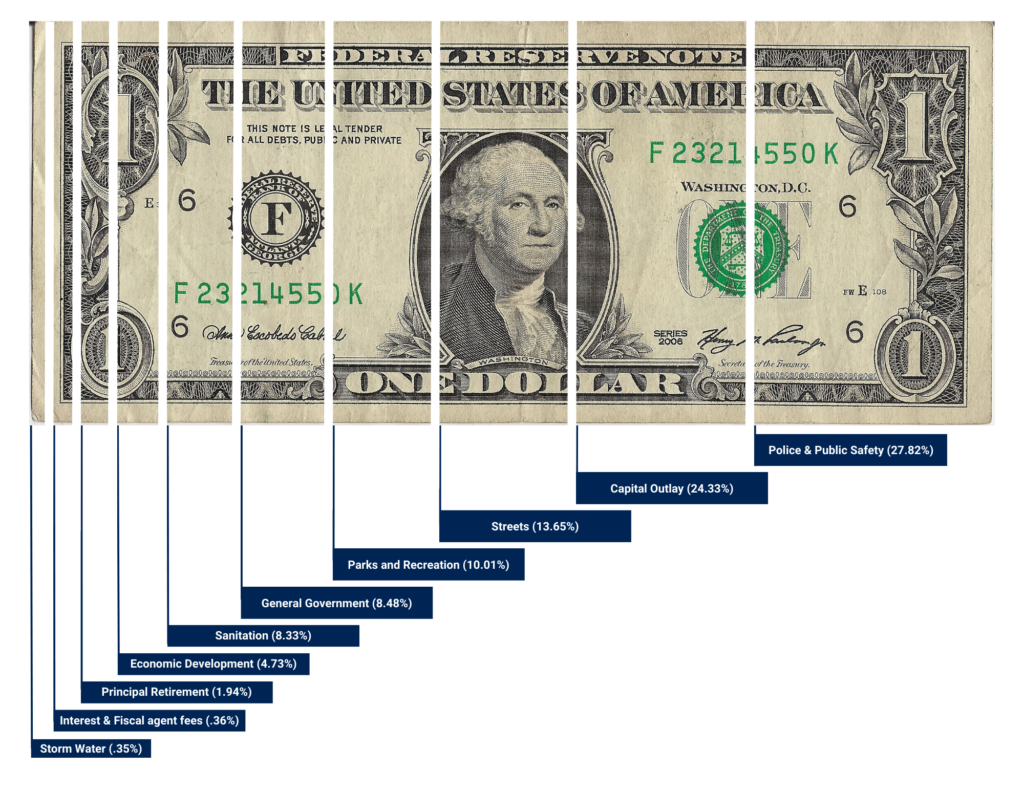
| Expenditure Category | 2022 Expenses | Percentage of Total Expenses |
|---|---|---|
| Police/Public Safety | $4,339,042 | 27.8% |
| Capital Outlay | $3,794,375 | 24.3% |
| Streets | $2,128,047 | 13.6% |
| Parks & Recreation | $1,560,425 | 10.0% |
| General Government | $1,322,405 | 8.5% |
| Sanitation | $1,299,629 | 8.3% |
| Planning & Development | $737,900 | 4.7% |
| Principal Retirement | $303,276 | 1.9% |
| Interest & Fiscal Agent Fees | $55,426 | 0.3% |
| Storm Water | $54,467 | 0.3% |
| Total Expenses from Governmental Funds in 2022 | $15,594,992 | 100% |
Debt Service:
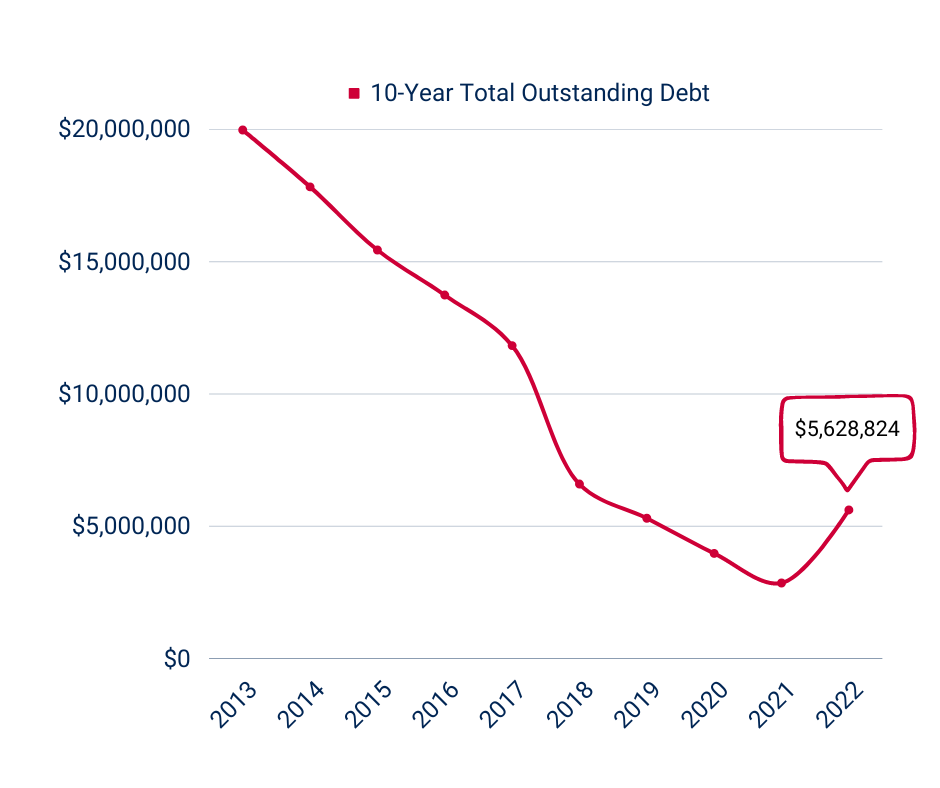
Understanding the City’s current debt:
In 2022, the City of Nixa paid off one debt issue. The City also issued $3,085,000 in special obligation bonds for the purchase of a water system from a private operation.
Of the 4 remaining debt issues already in existence, 2 are due to mature in 2023, one in 2025 and one in 2026.
The debt per capita at the end of 2022 is $227 which is down from $971 in 2013.
Our total outstanding debt at the end of 2022 was $5,628,824.
Capital Improvement Projects (CIPs):
Capital expenditures are big projects paid for in cash. We try to plan for these 5 years in advance, and budget accordingly so we can afford these large projects using cash rather than taking out additional debt.
Top 5 Governmental Fund CIPs in 2022:
| Road Improvements | $684,036 | |
| Police Shooting Range | $668,531 | |
| Stormwater Improvements | $501,900 | |
| McCauley Park Playground Improvements | $106,043 | |
| Aquatics Slides Improvements | $37,932 |
Enterprise Fund Net Position
Where Does the Money Come From?
Revenues by Fund
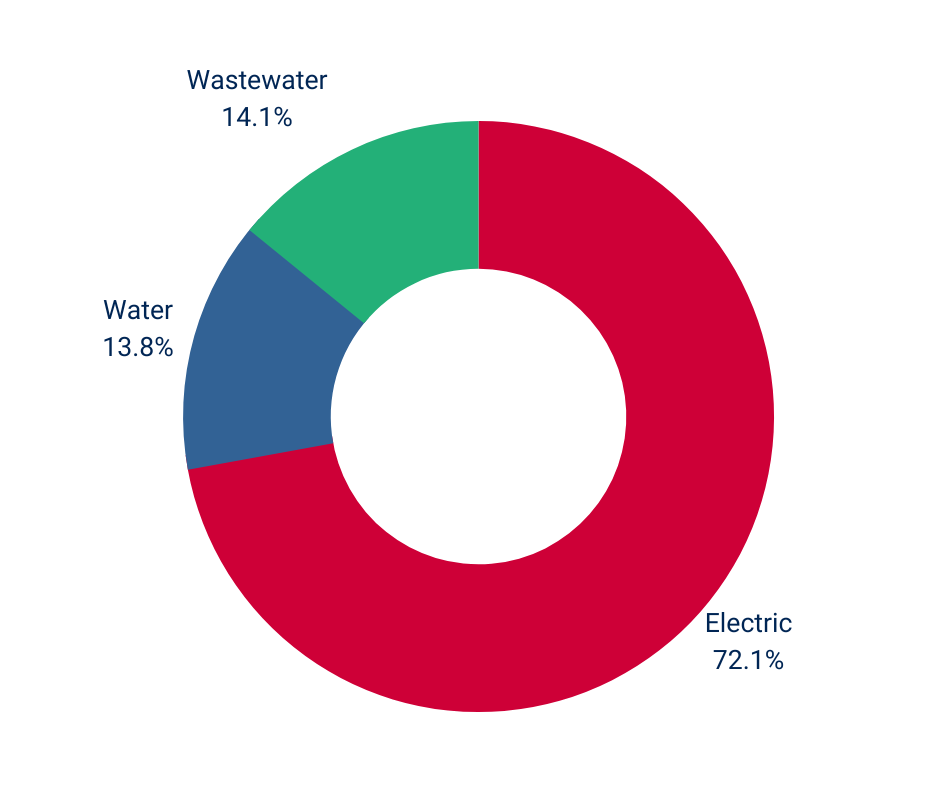
| Electric | $19,154,282 |
| Water | $3,653,275 |
| Sewer (Wastewater) | $3,751,558 |
| Total: | $26,559,115 |
Where Does the Money Go?
Expenses by Fund
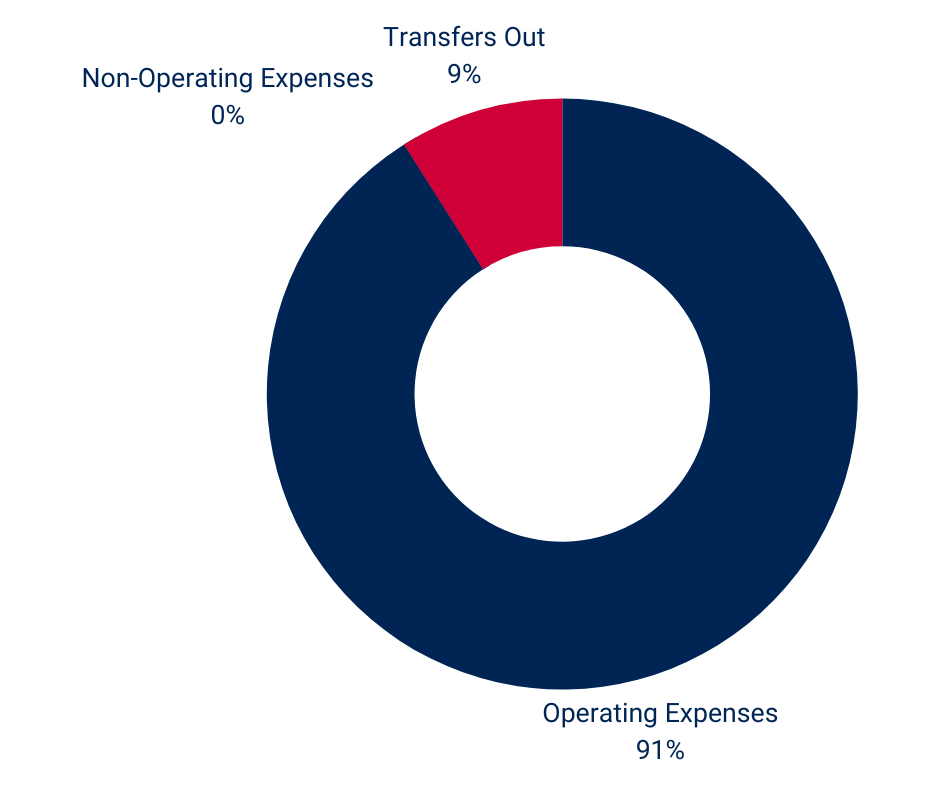
| Operating Expenses | $13,910,444 |
| Non-Operating Expenses | $0 |
| Transfers Out | $1,319,378 |
| Total: | $15,229,822 |
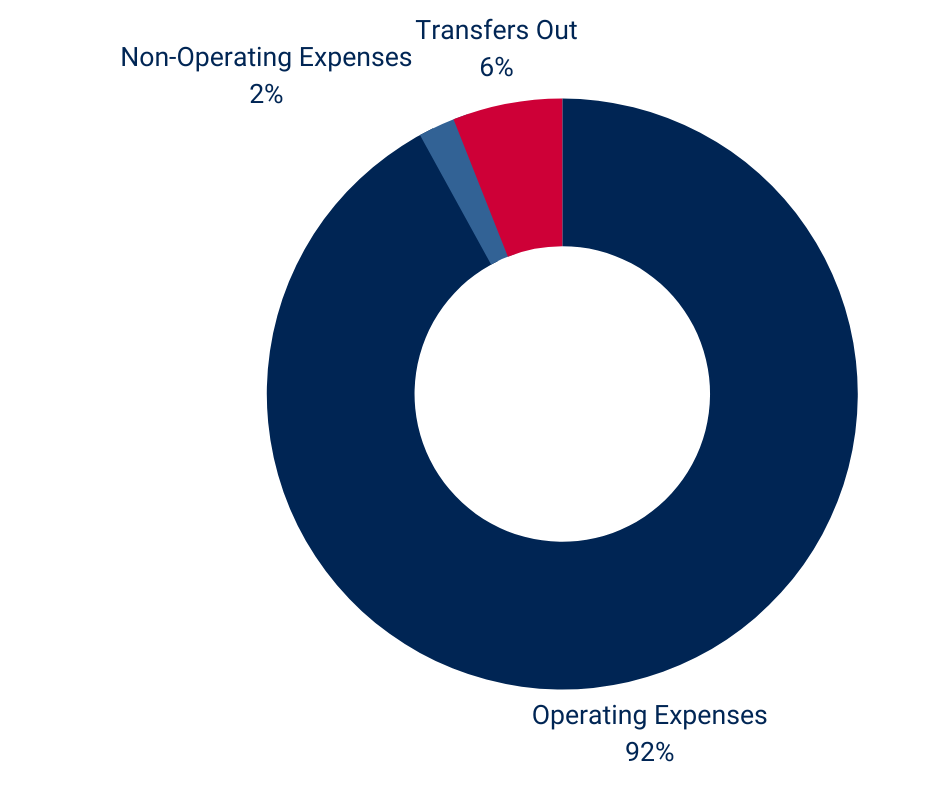
| Operating Expenses | $2,843,019 |
| Non-Operating Expenses | $42,290 |
| Transfers Out | $194,594 |
| Total: | $3,084,903 |
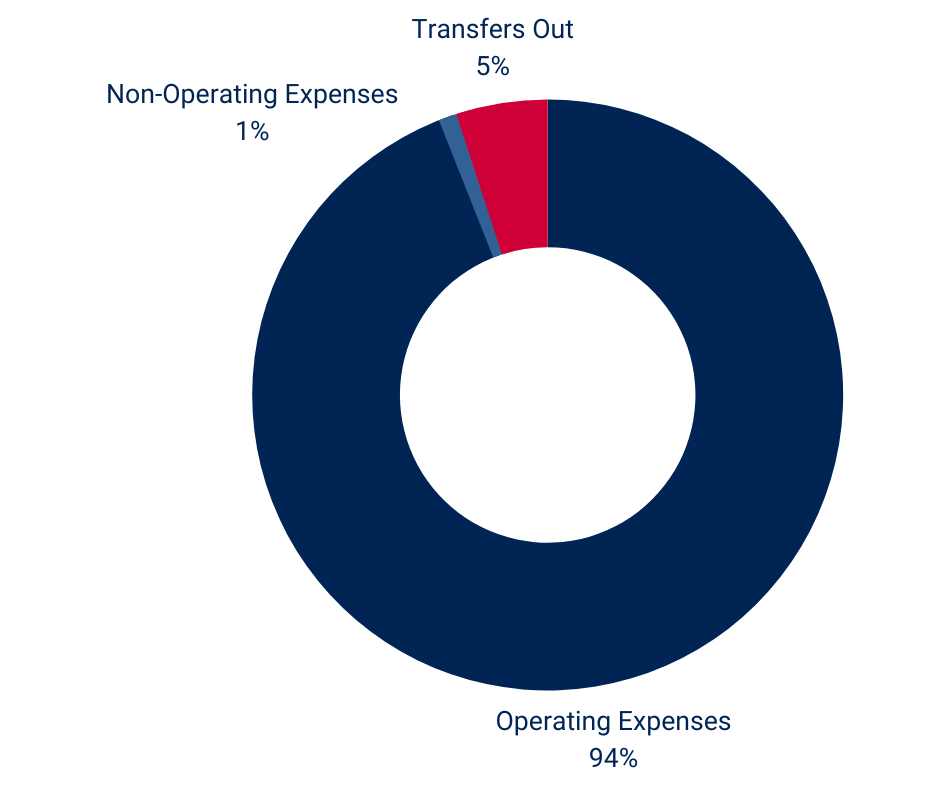
| Operating Expenses | $2,766,927 |
| Non-Operating Expenses | $31,021 |
| Transfers Out | $152,863 |
| Total: | $2,950,811 |
Top 10 Enterprise Fund Capital Projects for 2022
| 1. | Purchase of 2 water systems from a private operation (RDE & Tuscany Hills) | $3,000,000.00 |
| 2. | Electric line relocation SH 14 East | $4,604,112.55 |
| 3. | Tracker to Cheyenne tie line (electric) | $397,113.71 |
| 4. | Truman Water Line | $253,387.68 |
| 5. | South St. Sewer | $234,621.00 |
| 6. | SH 14 water line crossings & replacement | $195,711.25 |
| 7. | Leann St. to Nicholas St. tie line (electric) | $131,297.58 |
| 8. | Biosolids Centrifuge (wastewater) | $124,209.60 |
| 9. | Well House for Well #1 | $116,331.52 |
| 10. | South Truman Blvd. | $115,251.25 |